 WonksAnonymous
Map the Peak Cash Gap on a Manufacturing Order
Separate net working capital and an operating working-capital figure from the monthly cash gap of one manufacturing order. Plant amounts stay blank.
A balance-sheet surplus can still fail to cover cash that leaves before a manufacturing customer pays. Net working capital, an operating working-capital figure, and the peak cash gap of one order are three different measures.
A working capital requirement calculation for a manufacturing company is not the cash that one order needs on its worst day. OpenStax, in Principles of Finance 2e, section 19.1 (published June 24, 2026), defines net working capital as current assets minus current liabilities, and a cash cycle in days. In that section’s King Sized Products illustration the cash cycle is 57.2 days. Swoop, last reviewed on March 2, 2026, uses a different formula, accounts receivable plus inventory minus accounts payable, and its worked example equals $40,000. Those figures belong to the pages that published them. This page does not supply a dollar amount, a day count, or a peak gap for a plant. The cells below stay blank until this order’s own records fill them.
Scroll horizontally to see all columns.
| Stage on this order | Date the stage starts | Date the stage ends | Cash still unpaid at the end of the stage |
|---|---|---|---|
| Raw materials | |||
| Work in process | |||
| Finished goods | |||
| Customer receivable |
Write dates from this order only. A blank cell means the record is not in front of you. Do not copy the textbook days into it.
Which total are you calling working capital?
OpenStax section 19.1 uses working capital for the cash needed to meet daily, weekly, and monthly operating needs. Gross working capital, in that section, is current assets: cash and cash equivalents, marketable securities, accounts receivable, and inventory. Net working capital is current assets minus current liabilities. In the section’s example, $1,000,000 of current assets and $750,000 of current liabilities produce net working capital of $250,000. The same section lists current liabilities that sit in that subtraction: accounts payable, dividends payable, notes payable due within a year, the current portion of deferred revenue, current maturities of long-term debt, interest payable, income taxes payable, and accrued expenses such as compensation owed to employees.
That $250,000 is the textbook’s coverage example. It is not cash in a bank, and it is not this plant.
Esade’s January 2025 explanation uses the same subtraction. In its example, current assets of €600,000 minus current liabilities of €400,000 equal €200,000 of working capital. Esade describes current assets as items convertible to cash in under 12 months, including bank balances, financial investments, and inventory expected to be sold soon, and current liabilities as obligations due within 12 months.
eCapital’s glossary, in the copy retrieved on October 11, 2026, also sets working capital requirement equal to current assets minus current liabilities. It includes cash, accounts receivable, inventory, and other short-term assets, and it subtracts accounts payable, short-term debt, and other obligations due within one year. On that page, a positive result means current assets cover current liabilities. That is eCapital’s reading of the balance-sheet difference. It is not a statement about one order’s worst day.
Swoop’s formula is narrower. The page last reviewed on March 2, 2026 states: working capital requirement equals (accounts receivable + inventory) − accounts payable. Accounts receivable are payments due from customers. Inventory, on that page, is the value of unsold goods or raw materials. Accounts payable are amounts still owed to suppliers. In Swoop’s positive example, $50,000 of receivables plus $30,000 of inventory minus $40,000 of payables equals $40,000. Swoop reads a positive result as more cash needed to run operations, and a negative result as less cash tied up in those three accounts. The sign does not mean what eCapital’s sign means, because the formulas are not the same. This page does not treat either sign as proof that a customer’s payment will arrive.
OpenStax also shows why a ratio on one date is a weak stand-in for later cash. In its current-ratio illustration, $2,000,000 of current assets and $1,000,000 of current liabilities give a current ratio of 2. The section’s first drawback is that the ratio is a working-capital figure at a point in time and is not indicative of future liquidity or future cash flows.
Takeaway: Keep the all-in balance-sheet difference and the receivables-plus-inventory-minus-payables figure in separate rows. Neither row is the peak cash gap of this order.
What does the textbook cash cycle count?
OpenStax section 19.1 calls the cash cycle, also the cash conversion cycle, the time from when the business begins production and acquires materials and other inventory until it receives cash from customers, offset by the time it takes to pay suppliers. The formula in that section is:
Cash cycle = inventory conversion period + receivables collection period − payables deferral period
The section calculates each period from a turnover, then divides 365 by that turnover. Average inventory is (beginning inventory + ending inventory) / 2, and the same average is used for receivables and payables. Inventory turnover is cost of goods sold divided by average inventory. Receivables turnover is credit sales divided by average accounts receivable. Payables turnover, as that section writes it, is cost of goods sold divided by average accounts payable.
The section then solves one illustration, King Sized Products. These are the figures stated in that solution, including the rounded turnovers and day counts:
Scroll horizontally to see all columns.
| Line | OpenStax King Sized Products illustration |
|---|---|
| Annual credit sales | $40,000,000 |
| Cost of goods sold | $30,000,000 |
| Average inventory | $3,000,000 |
| Average accounts receivable | $6,000,000 |
| Average accounts payable | $2,800,000 |
| Inventory turnover | $30,000,000 / $3,000,000 = 10 |
| Inventory conversion period | 365 / 10 = 36.5 days |
| Receivables turnover | $40,000,000 / $6,000,000 = 6.67 |
| Receivables collection period | 365 / 6.67 = 54.7 days |
| Payables turnover | $30,000,000 / $2,800,000 = 10.71 |
| Payables deferral period | 365 / 10.71 = 34 days |
| Cash cycle | 36.5 + 54.7 − 34 = 57.2 days |
That 57.2 days is the textbook illustration of an annual average. It is not this plant’s cycle, and it is not a dollar gap. Leave the order’s own day counts blank. The section says that shortening the inventory conversion period and the receivables collection period, or lengthening the payables deferral period, shortens the cash cycle. That is a statement about those three periods. It does not fill a date on this order.
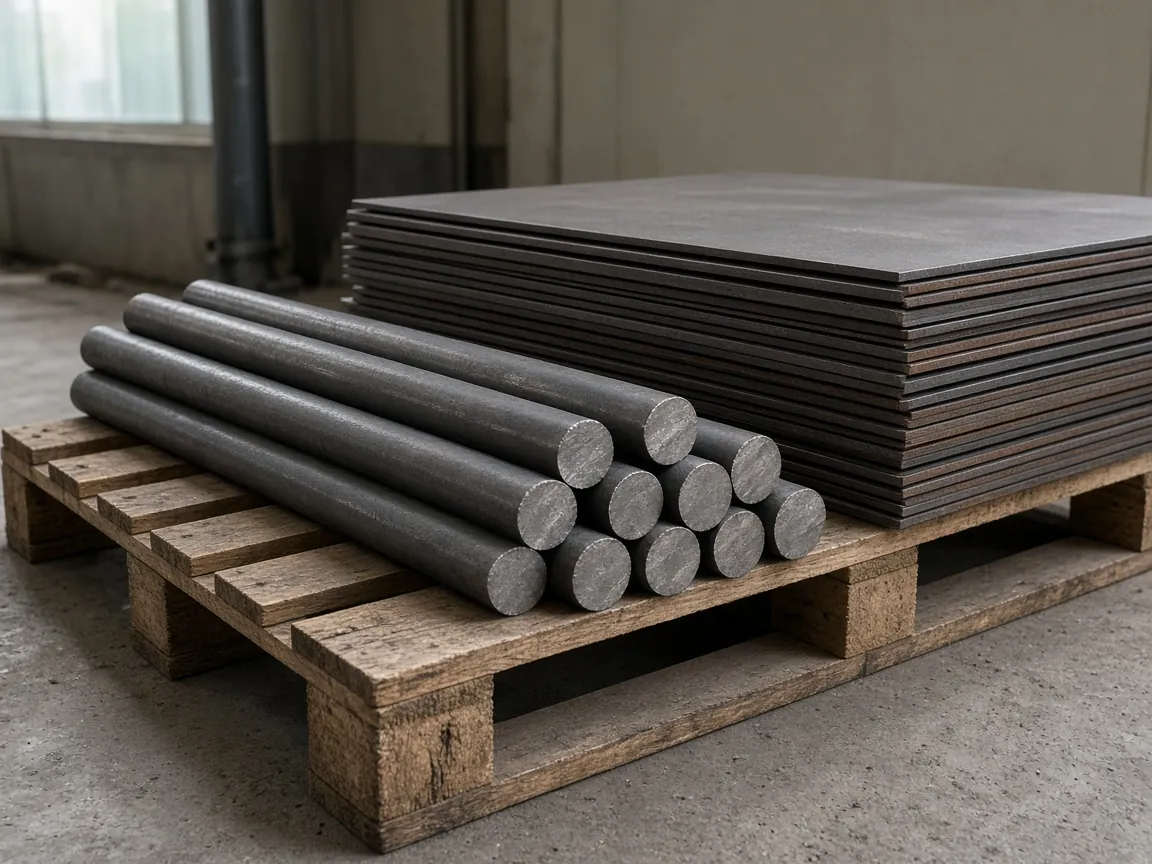
Swoop discusses seasonality with a retail example: holiday inventory can raise the working-capital requirement, and quieter months can lower it. That passage is about a selling season. It is not a materials-to-receivables calendar for one factory order.
The same OpenStax section says working capital has a permanent base that is always needed, and a total that rises when production and sales are higher. One large order can sit in that extra band. The section does not give the extra band a dollar amount. This page does not either.
Where does cash sit on one manufacturing order?
The textbook cash cycle uses one inventory period. A manufacturing order can hold cash in four places that do not clear on the same day: raw materials after the supplier is paid, work in process while conversion is paid, finished goods after they are made and before the customer pays, and the receivable after the invoice and before the receipt. Swoop’s inventory line, unsold goods or raw materials, does not split those stages. The blank timeline at the top is that split. Fill a date only when you have it.
Cash leaves when it leaves the bank. OpenStax notes that employees are paid out of working capital, that receivables have to be collected before they are cash, and that inventory has to be sold before it is cash. Record the month of the payment or the receipt, not the month the cost was accrued and not the month the invoice was issued, unless those dates are the same on this order. If you know the accrual and not the payment, leave the cash cell blank.
A balance-sheet facility is a different object from this timeline. The U.S. Small Business Administration page “Increasing access to capital” says an asset-based 7(a) Working Capital Pilot loan allows manufacturers to draw working capital against inventory and accounts receivable. That sentence describes a financing arrangement. It is not a measurement of this order’s peak gap. This page does not cover eligibility, interest, or whether to borrow.
How do you fill the monthly cash sheet?
Copy the sheet. One row is one month in which this order still has cash out or cash in. Add rows until the order is collected. Stop when a month has no record.
Scroll horizontally to see all columns.
| Month on this order | Cash out | Cash in | Net (cash in minus cash out) | Cumulative |
|---|---|---|---|---|
| Peak cash gap (most negative cumulative) |
- Write the month. A week of wages and a month of materials do not share a row until you have put them on one calendar month on purpose.
- Cash out is money that leaves for this order in that month: materials actually paid, wages actually paid, and other conversion costs actually paid. Leave out the purchase of the machine. Imported equipment costs beyond the factory price is the list for landing and running a machine. That purchase stays off this sheet unless the order itself is the machine.
- Cash in is money the customer pays for this order in that month. A shipment with no receipt is not cash in.
- Net equals cash in minus cash out for that row. If either amount is blank, leave net blank.
- Cumulative equals the prior cumulative plus this net. If no cash for this order has left yet, the prior cumulative is zero. If some cash has already left and you do not have the amount, leave the cumulative column blank.
- The peak cash gap is the most negative cumulative on the sheet. If any month in the span is blank, leave the peak cell blank. Do not estimate the missing month to finish the row.

Finished goods can sit at the dock while the receivable is still open. That wait is a date on the timeline and a month with cash out already spent and cash in still blank. It is not, by itself, a number this page can supply.
Takeaway: The peak gap is the most negative cumulative you can compute from complete months. A blank month keeps the peak blank.
What changes under a second set of payment terms?
Use the same order twice. Column A is the dates and amounts in the terms you have. Column B is a second set of dates and amounts. If the second set is only an idea and you do not have its dates, leave column B blank. A blank column is not a worse deal and not a better one.
Scroll horizontally to see all columns.
| Line | Terms you have | Alternative terms |
|---|---|---|
| Supplier payment date | ||
| Customer payment date | ||
| Materials cash out | ||
| Conversion cash out | ||
| Customer cash in | ||
| Customer receipt if it arrives later than the stated term | ||
| Peak cumulative gap |
OpenStax’s statement is the reason to run the second column: a shorter receivables collection period or a longer payables deferral period shortens the cash cycle, and a shorter inventory period does the same. On this sheet that shows up only as dates and cash amounts you write in. If a term also changes the amount paid or collected, write the amount you will actually pay or receive. If you do not have it, leave the cell blank. Do not assume the dollars are unchanged, and do not invent the number of days a late receipt would add.
The later-receipt row is the sensitivity to a slower collection. Both the date and the peak stay blank until you name that later date and recompute the cumulative from the monthly sheet. The textbook’s 34-day payables deferral and 54.7-day collection period do not belong in either column.
Common mistake: Pasting 57.2 days, $40,000, $250,000, or €200,000 into the peak-gap cell. Each of those is a published illustration of a different formula.
When this sheet does not apply
The sheet is one order’s cash timing. It is not a loan application, a credit decision, or a rate. The SBA sentence above is a boundary, not a recommendation.
It does not restate landed cost, duty, or freight. Those sit on the imported-equipment page. It does not price inventory holding cost, scrap, or a storage fee. If a holding cost is cash that leaves during the order, it belongs in cash out only when you have the payment. Otherwise the cell stays blank.
A positive net working capital figure, a positive operating working-capital figure, and a current ratio of 2 in the textbook illustration do not show that this order’s cumulative stays positive. OpenStax already limits the current ratio: it is not future cash flow.
The trade and supply chains reading guide is the index for the machine-price, quote, and contract-packing notes beside this one.
Method and sources
Balance-sheet definitions, the current-ratio illustration ($2,000,000 / $1,000,000 = 2) and its point-in-time limit, the net-working-capital example ($1,000,000 − $750,000 = $250,000), the cash-cycle formula, the turnover formulas, the King Sized Products solution (57.2 days), and the statement that shortening inventory conversion or receivables collection, or lengthening the payables deferral, shortens the cash cycle, are from OpenStax, Principles of Finance 2e, section 19.1, “What Is Working Capital?” Authors: Julie Dahlquist and Rainford Knight. Publisher: OpenStax, Houston, Texas. Publication date: June 24, 2026. The copy read for this page is the cached text of that section (HTTP 200), which carries a copyright line dated July 6, 2026. Section URL: 19.1 What Is Working Capital?.
The €600,000, €400,000, and €200,000 example is from Esade, “What is working capital and how is it calculated?”, January 2025, in the cached text retrieved October 11, 2026.
The receivables-plus-inventory-minus-payables formula, the $50,000 / $30,000 / $40,000 / $40,000 example, the positive and negative readings of that result, and the retail seasonality passage are from Swoop, “What does working capital requirement measure?”, last reviewed March 2, 2026, cached text retrieved October 11, 2026.
eCapital’s current-assets-minus-current-liabilities wording, including cash and short-term debt, is from its working-capital-requirement glossary, cached text retrieved October 11, 2026.
The sentence on drawing working capital against inventory and accounts receivable is from the U.S. Small Business Administration page “Increasing access to capital,” cached text (HTTP 200). No eligibility rule and no rate from that page is used here.
The blank cells are intentional. No plant ledger was used. The textbook and glossary illustrations are labeled in the tables above and are not inputs to the blank cells.
How this site checks an analysis is on the editorial policy.