 WonksAnonymous
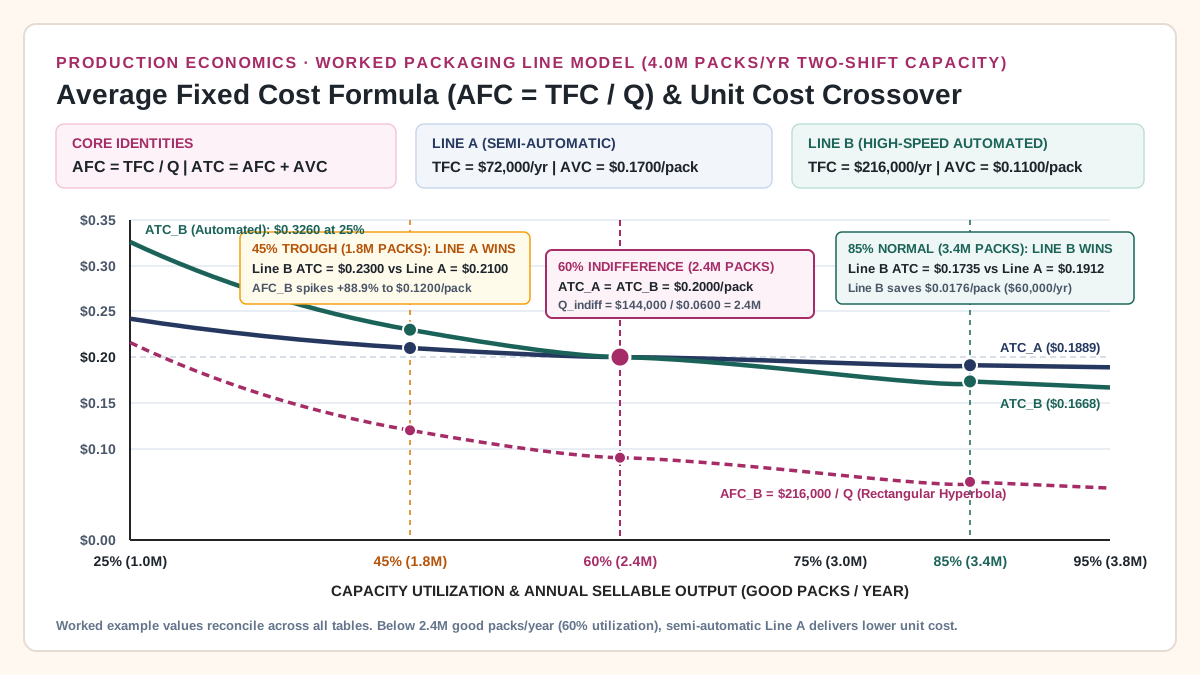
Average Fixed Cost Formula, Cost Per Unit Calculator, and Operating Leverage
Use the average fixed cost formula (AFC = TFC / Q) and unit cost calculator to see why an automated line costs more per pack than a semi-automatic line at 45% utilization.
Economics of Work, Production & Automation
What a good pack costs to make once downtime, scrap, changeovers and the slowest machine on the line are counted.
Reading guide
Production economics asks what it costs to make one sellable unit, and why that cost moves from month to month. The five analyses here use packaging lines as the example, but the logic fits any line where machines, people and materials turn out a countable product.
The questions are everyday ones. Should the plant buy a faster machine, or fix the stage that limits the line? What does one more changeover cost? What is an hour of unplanned downtime worth? Is film or a premade pouch cheaper at your volume and number of designs?
Count good units, not nameplate speed. A plant pays for every scheduled hour in wages, overhead and energy, but it sells only the units that pass inspection. Nameplate speed is what a machine can do under good conditions. Good units per period are what the line actually did.
Downtime, slow running, changeovers and rejects all hit the same place: fewer good units from the same spending. They don’t need separate “lost output” lines, because they show up when you divide the period’s cash operating cost by the good units made in it.
The second half of the idea is that a line delivers what its slowest stage delivers in practice. An improvement counts only if it reaches that stage, or makes that stage run more reliably.
Before comparing volumes, use Fixed, Variable and Total Cost Formulas to separate period totals from per-unit averages and build a spreadsheet that reconciles. Its original illustrative example explains why a falling average need not mean a smaller monthly bill. Then use Average Fixed Cost Formula, Cost Per Unit Calculator, and Operating Leverage to model how AFC = TFC / Q behaves between 85% and 45% capacity utilization, where the cost indifference volume (Q_indiff) sits between semi-automatic and automated lines, and why GAAP (ASC 330-10-30) and IAS 2.13 cap inventory overhead absorption at normal capacity.
When one unit rate stops fitting the shift, use Variable Cost Formula: Packaging Line Examples Across Shift Limits to separate materials, piecework, overtime and energy steps; when the question is cost transferred into finished goods, use Cost of Goods Manufactured Formula: A Packaging WIP Reconciliation to reconcile material usage, current manufacturing costs and unfinished work.
When automation cuts operator hours on one line and the machines on another line keep running, use Allocate Manufacturing Overhead After Automation to apply one overhead pool on labor hours and again on machine hours. The sheet leaves the rates and the dollars blank until the plant’s own records fill them.
Before treating an industry percentage as a factory target, read Manufacturing Capacity Utilization: Why the National Rate Is Not a Plant Target. Its four-measure comparison separates national output indexes, plant output, machine hours and OEE, with a hypothetical example that uses no industry benchmark.
Begin with Cost per Good Pack. It defines the measure, shows how to avoid counting scrap twice, and keeps equipment investment on its own labeled line. The other four articles reuse its definition and numbers, so each goes faster once you’ve read it.
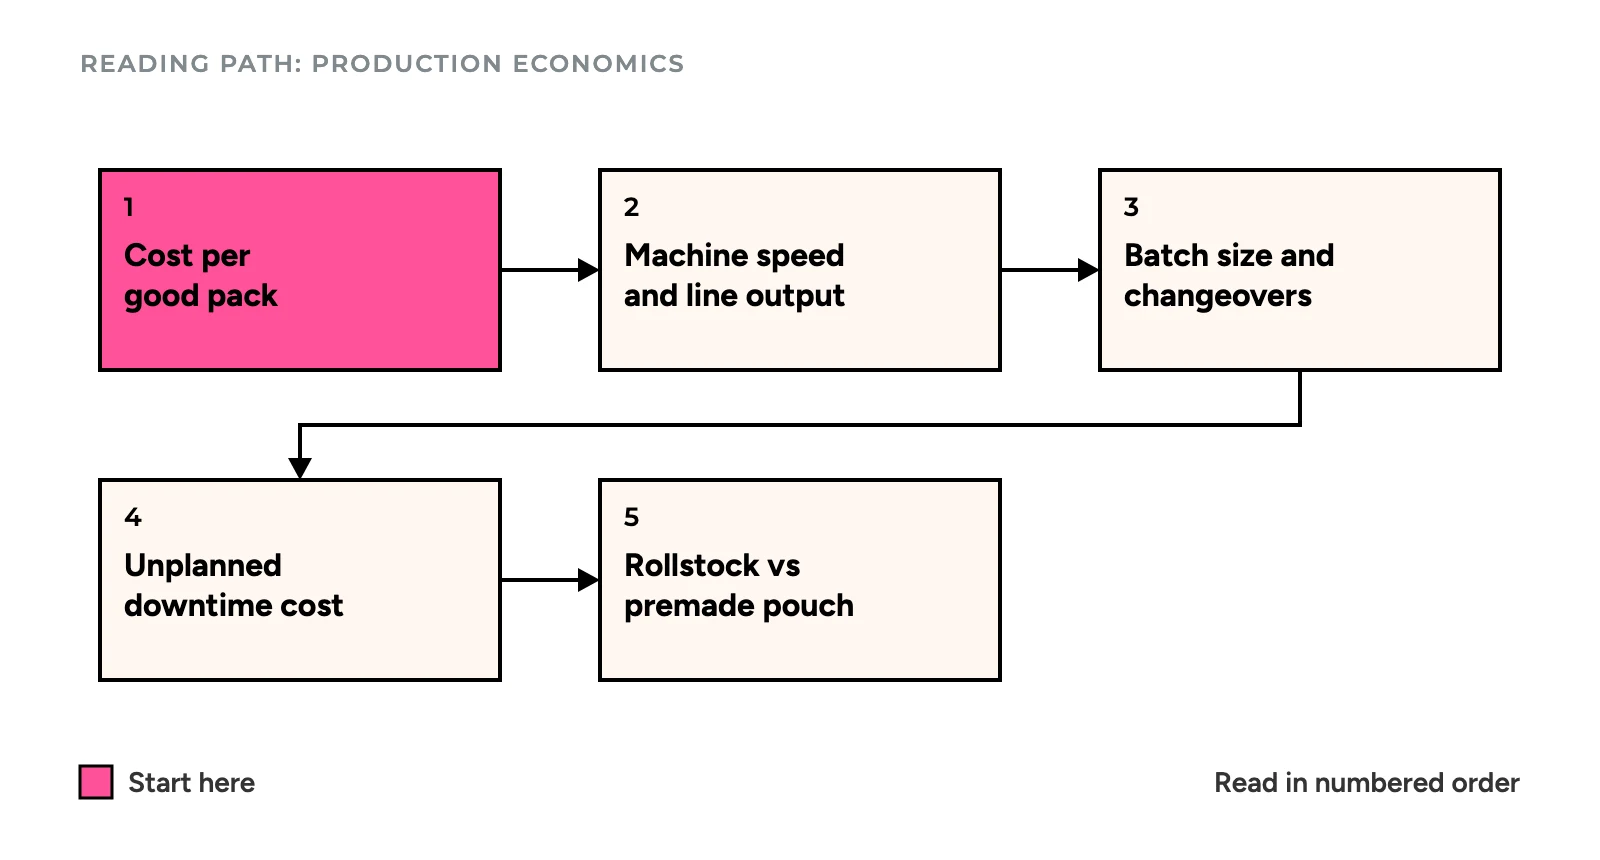
The order below goes from the measure itself, to what limits output, to what erodes it, and ends with a choice that uses all of it.
Once you have Cost per Good Pack in hand, you have the one formula the rest depend on: period cash operating cost divided by good packs, with a rule for not counting scrap and equipment twice. In its worked month, total spending rises by $3,250 while the cost of each good pack falls from $0.2232 to $0.2182.
Next, understand the three loss factors with Calculating OEE on Packaging Lines, which demonstrates how availability, speed, and quality compound, and use Overall Equipment Effectiveness Formula, Calculator, and the OEE Financial Bridge to test whether a +5% OEE improvement saves real cash (via scrap reduction or overtime elimination) or merely creates idle time on a demand-constrained line. Then read Why Faster Machines Do Not Always Increase Line Output before you spend on speed. In its four-stage example, a bagger rated at 80 packs per minute changes nothing, because the case packer limits the line at 35.64 good packs per minute. Raising that case packer’s availability adds 2,139 packs per shift. Find the bottleneck first, then decide what to buy.
Third is Small Batches and Frequent Changeovers, which prices what each extra changeover takes. Going from two to four changeovers per shift raises the cost per 1,000 good packs by 7.9% in the example. It also gives you a simple changeover log, and a comparison where a slower machine with quick changeovers beats a faster one on a busy schedule.
Fourth, Measuring the Cost of Unplanned Production Downtime helps when you need a dollar figure for repair, spare-parts and automation decisions. The same 90-minute stop is worth $4,330, $2,125 or $1,302, depending on whether you value it at selling price, lost contribution or recovery cost. Pick the measure that matches what actually happened to the output, and say which one you used whenever you quote the figure to someone else.
Last, Rollstock Versus Premade Pouches is the choice that uses everything above, because it needs good-pack cost, realistic speeds, changeover waste and an honest view of volume at the same time. Rollstock wins at 1.5 million packs a year in the example ($56.20 against $65.55 per 1,000), and premade pouches win at 300,000 ($105.22 against $122.40). A break-even belongs to an operating profile, not to a machine.
Production numbers feed every investment case. Read The True Installed Cost of Packaging Automation to see what belongs in the investment figure before you turn good-pack savings into payback. How Equipment Utilization Changes Automation Payback shows how the same machine can pay back in 16 months in one plant and in nearly seven years in another, with running hours as the difference.
Some of the questions go beyond the plant. Contract Packing Versus Owning a Packaging Line uses per-pack cost to decide whether to own a line at all. The Automation Investment and Trade and Supply Chains guides place these articles in their wider paths.
Every number in these pieces is a round example, labeled as one, and none of it comes from a quote, a benchmark or a customer. Swap in your own counters, logs and quotes before drawing a conclusion. The editorial policy describes how the analysis is checked.
Use the average fixed cost formula (AFC = TFC / Q) and unit cost calculator to see why an automated line costs more per pack than a semi-automatic line at 45% utilization.
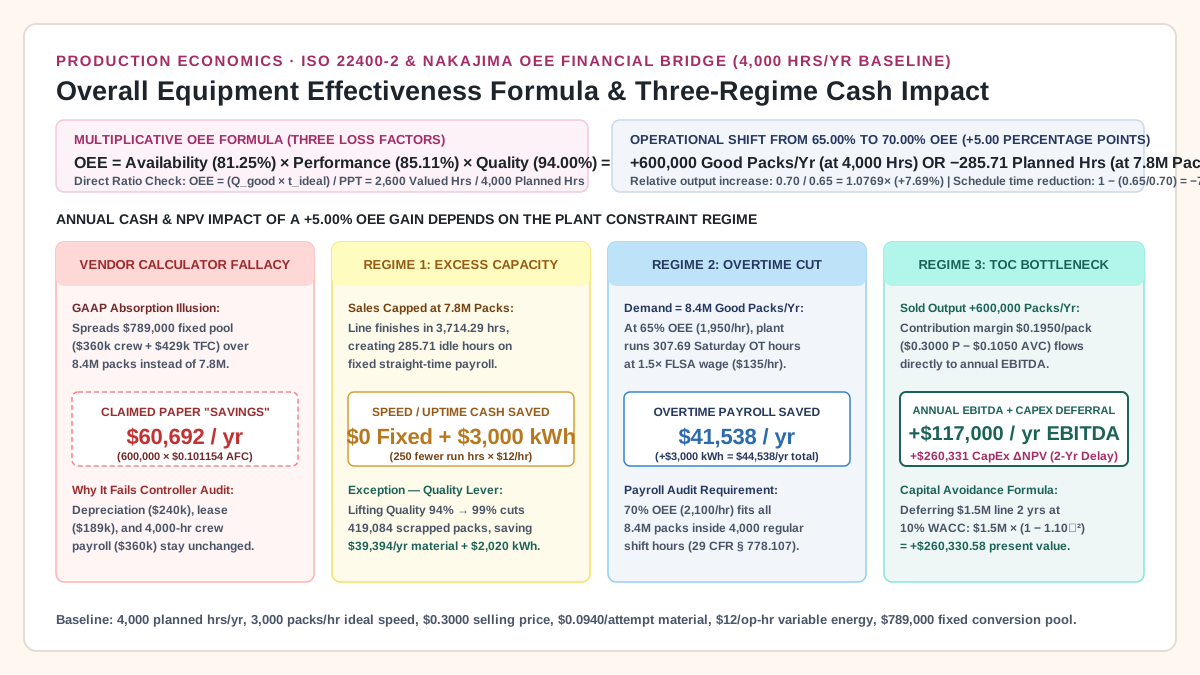
Use the overall equipment effectiveness formula (OEE = Availability × Performance × Quality) and financial calculator to test whether a +5% OEE gain saves cash or merely creates idle time.
Build a manufacturing-cost statement from raw-material usage, labor, overhead and WIP, then reconcile COGM to costed finished-goods receipts.

Model packaging materials, piecework, overtime and energy separately, with assumed examples showing where one variable rate stops working.
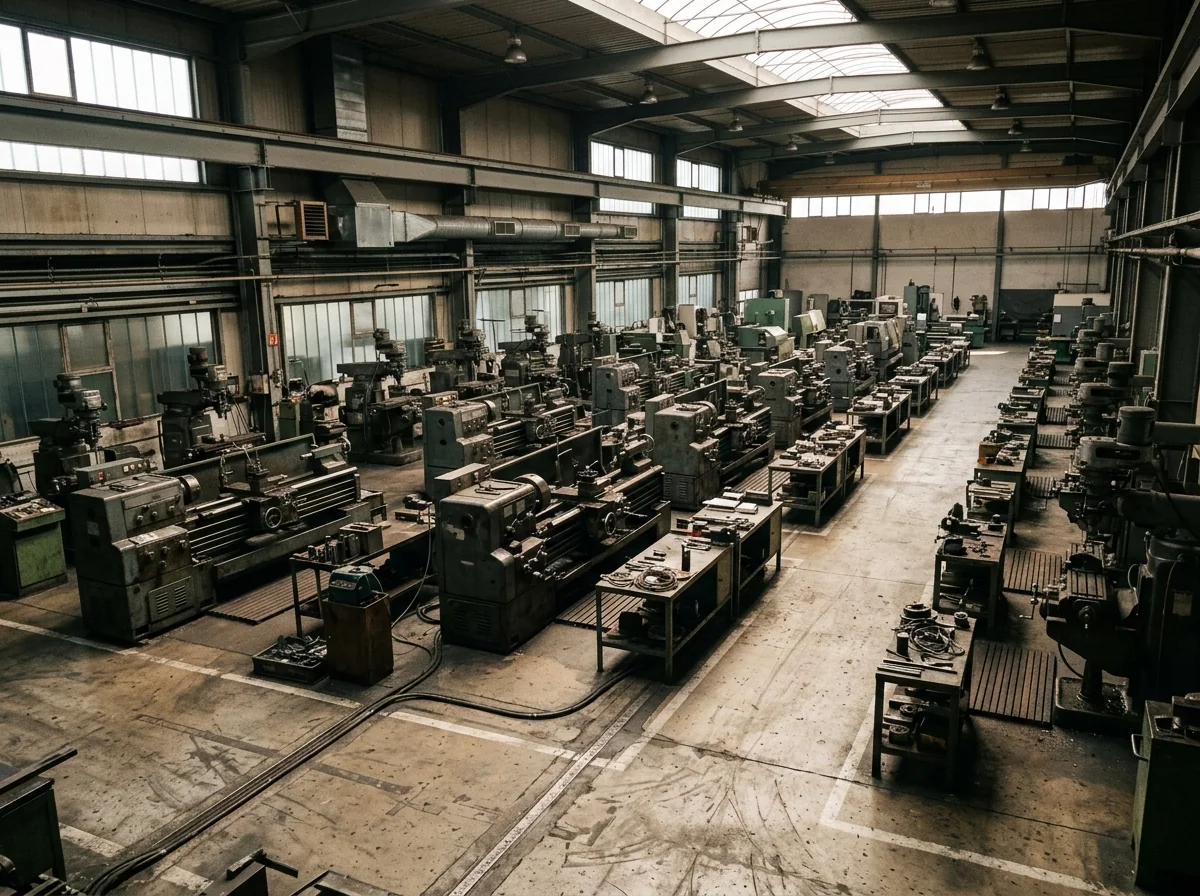
Compare national capacity utilization, plant output, machine hours and OEE by their denominators, with a labeled plant example and a records checklist.
Apply one manufacturing overhead pool on labor hours and again on machine hours. Rates and dollars stay blank until your records fill them.
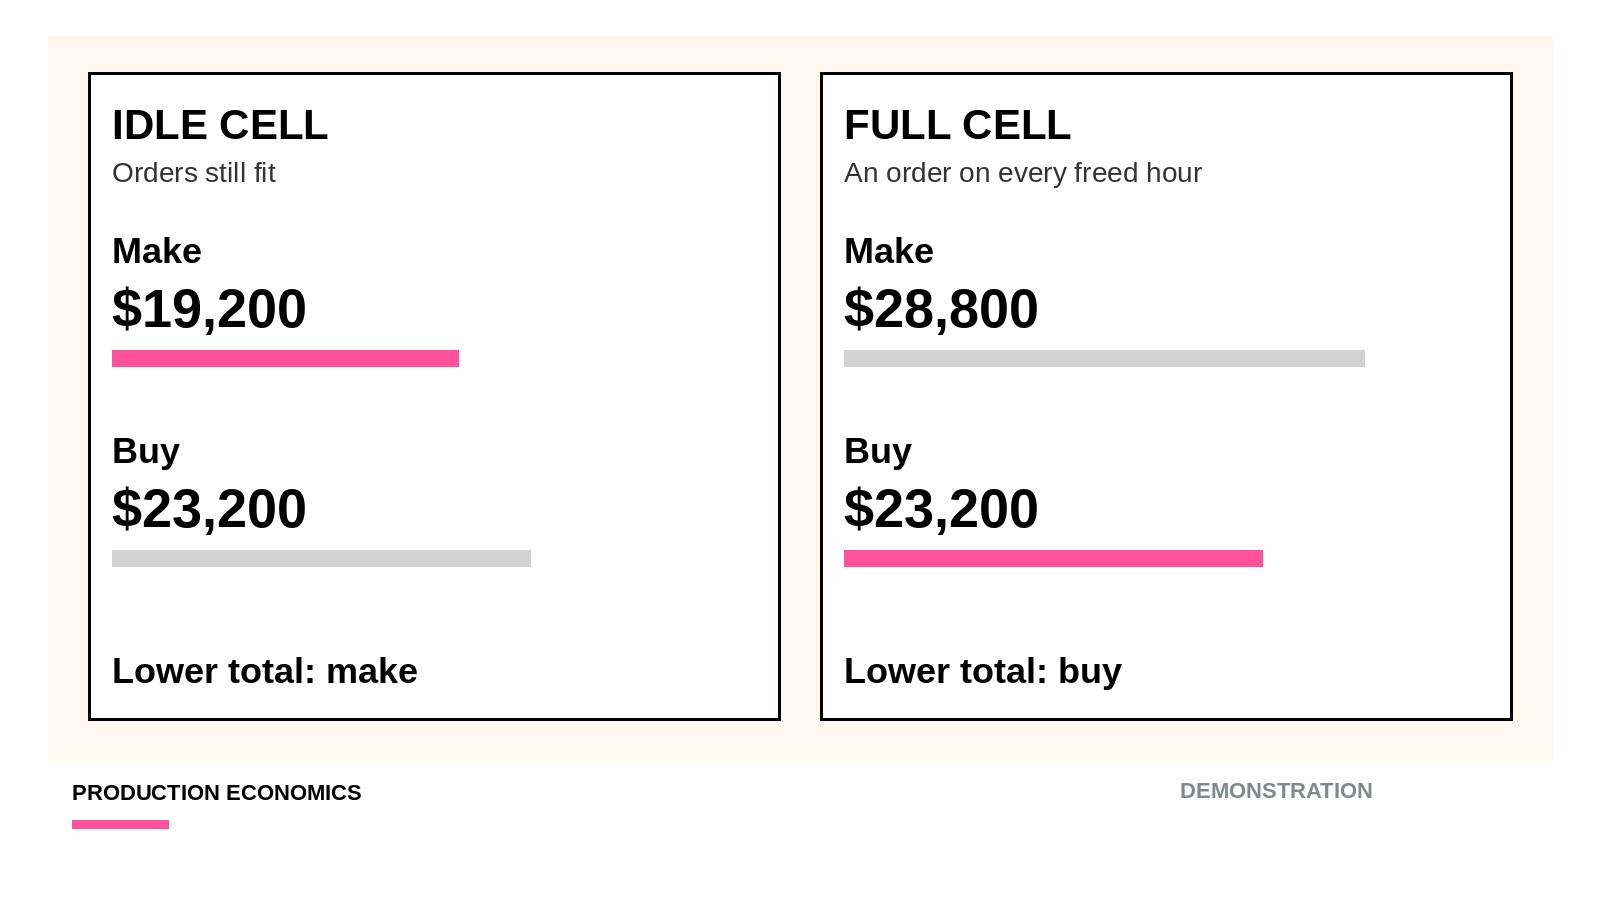
Compare avoidable make cost with purchase-and-delivery cost, then add only the contribution of orders the same hours could ship.
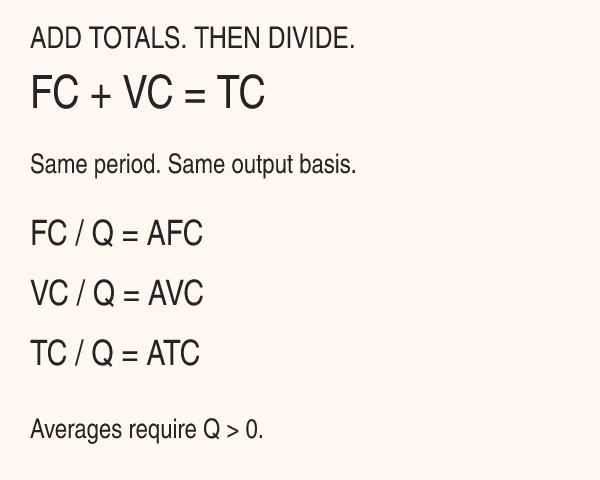
Calculate FC, VC, TC, AFC and AVC with a worked production-line example, separate total and unit-cost charts, and copyable Excel formulas.
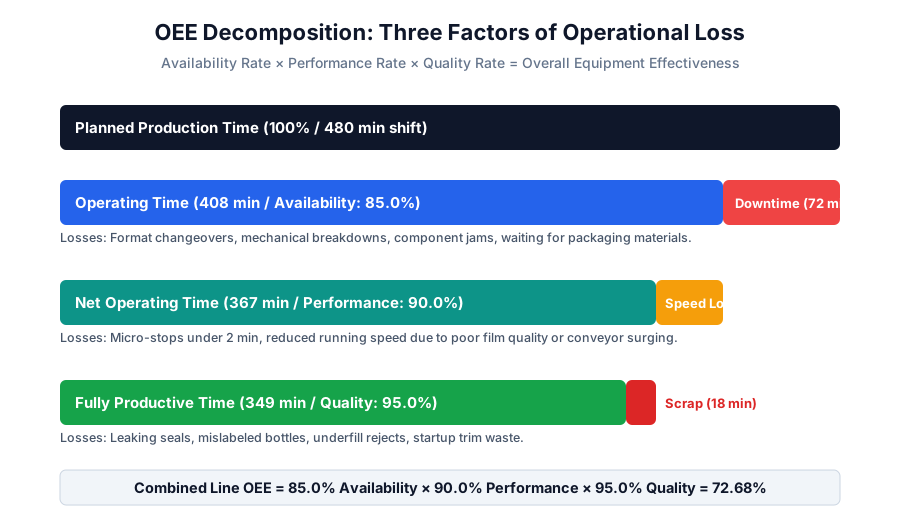
A practical guide to calculating Overall Equipment Effectiveness (OEE) on packaging lines, diagnosing the six big losses, and avoiding bottleneck averaging errors.
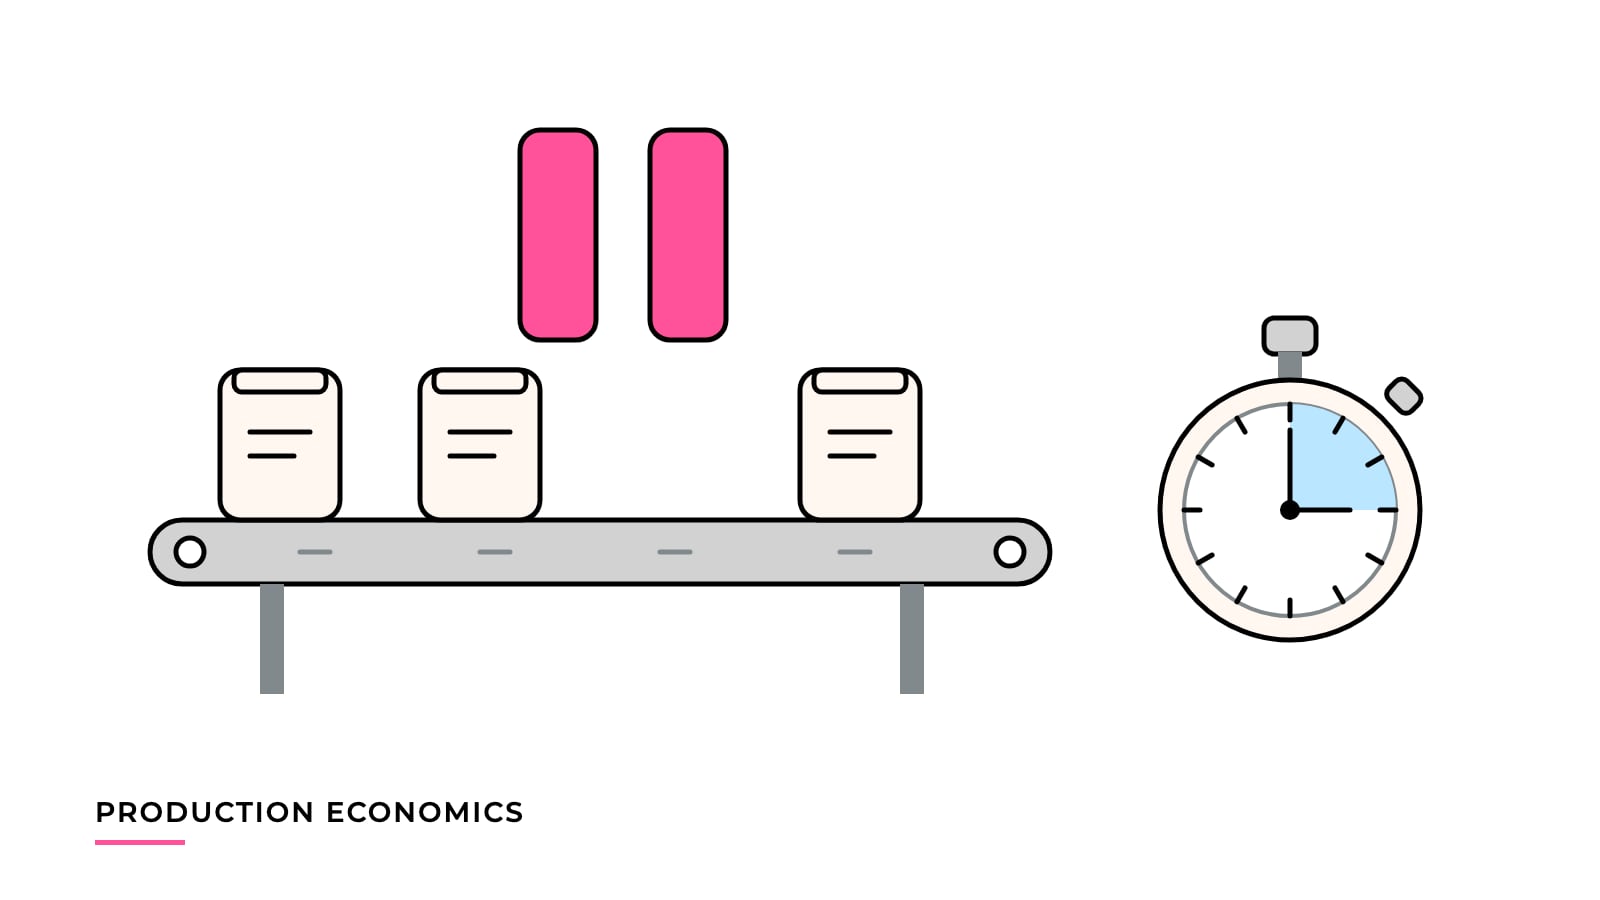
Three ways to value an hour of unplanned downtime (lost revenue, lost contribution, recovery cost), when each applies, and a worked 90-minute stop.
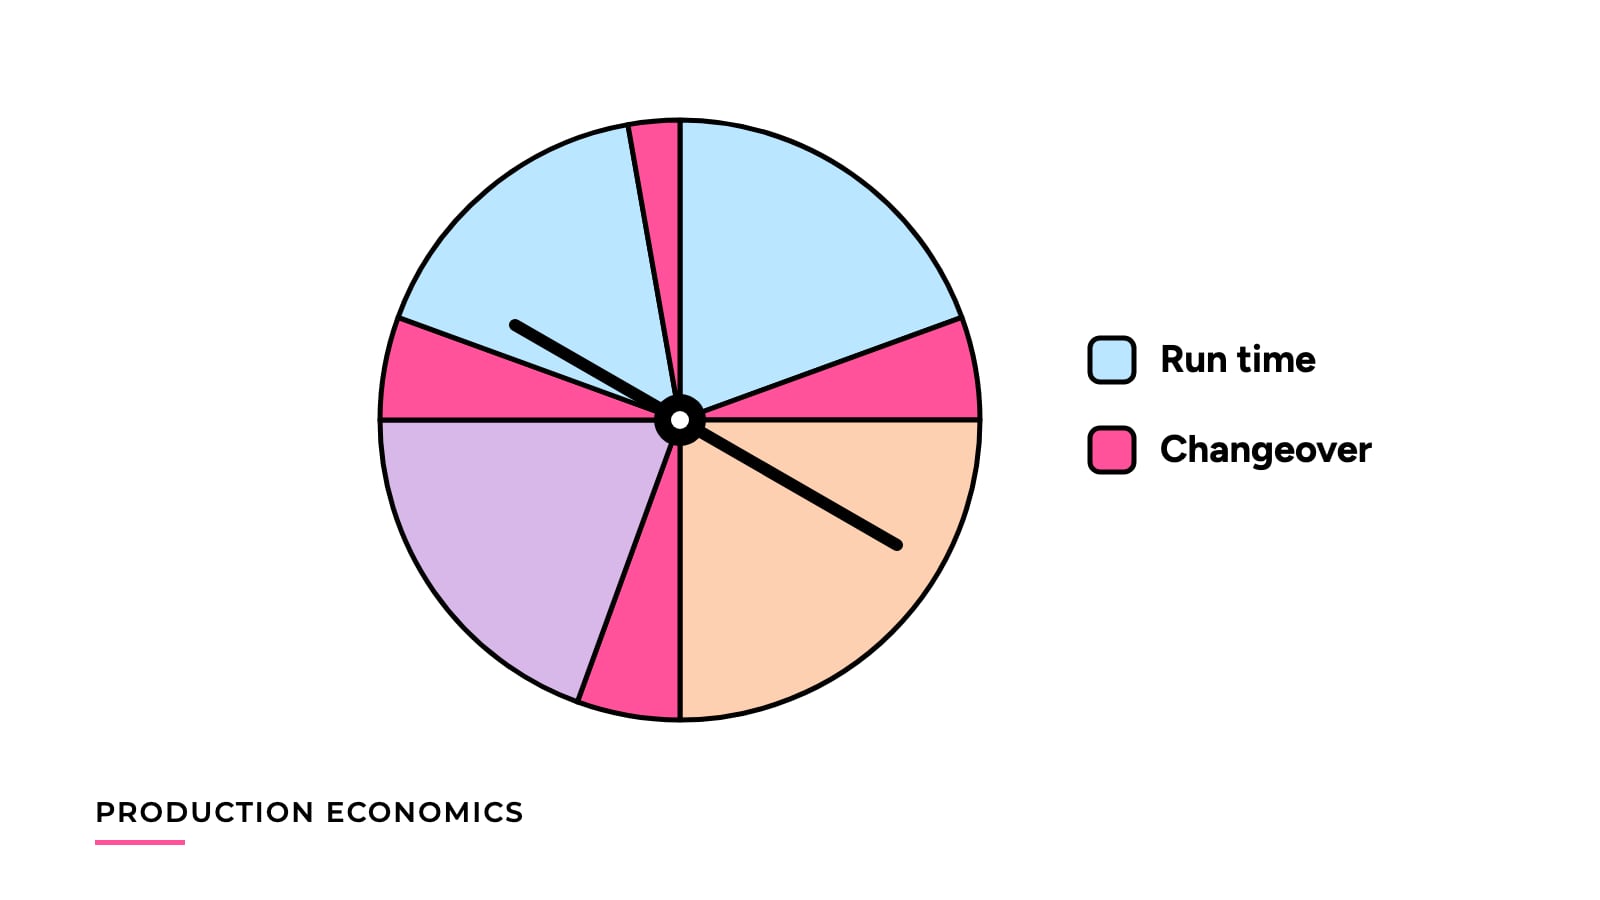
A model linking batch size, changeover time and run time to good packs and cost per good pack, with a worked shift example and a simple changeover log.
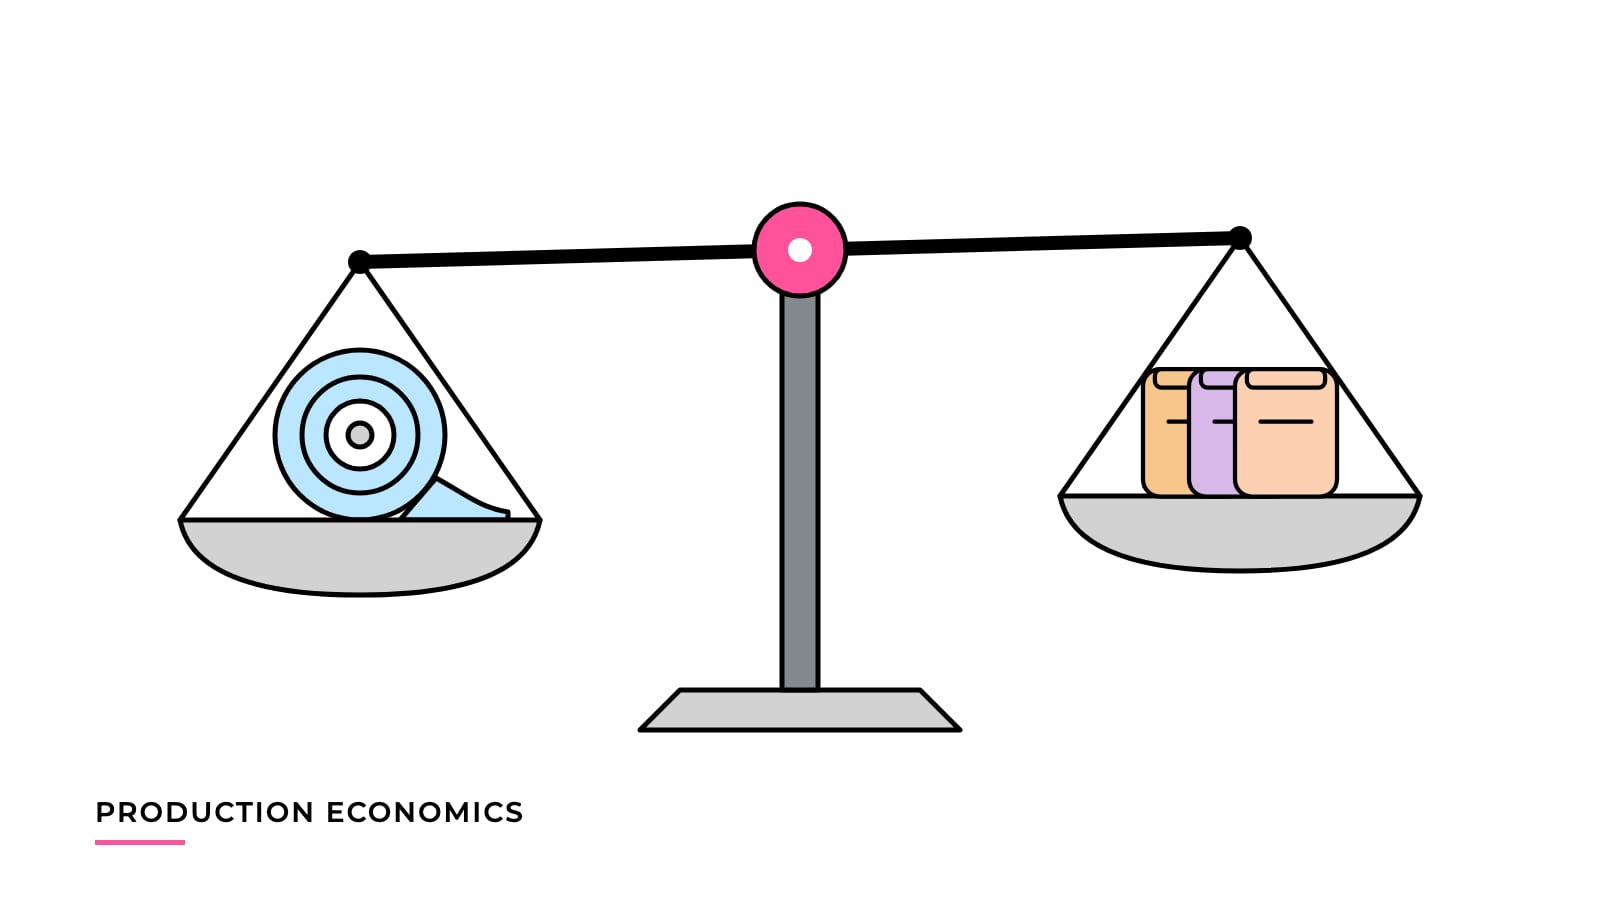
How to put rollstock and premade pouches on one cost basis: material, waste, labor, equipment and order structure, with two worked scenarios and a break-even formula.
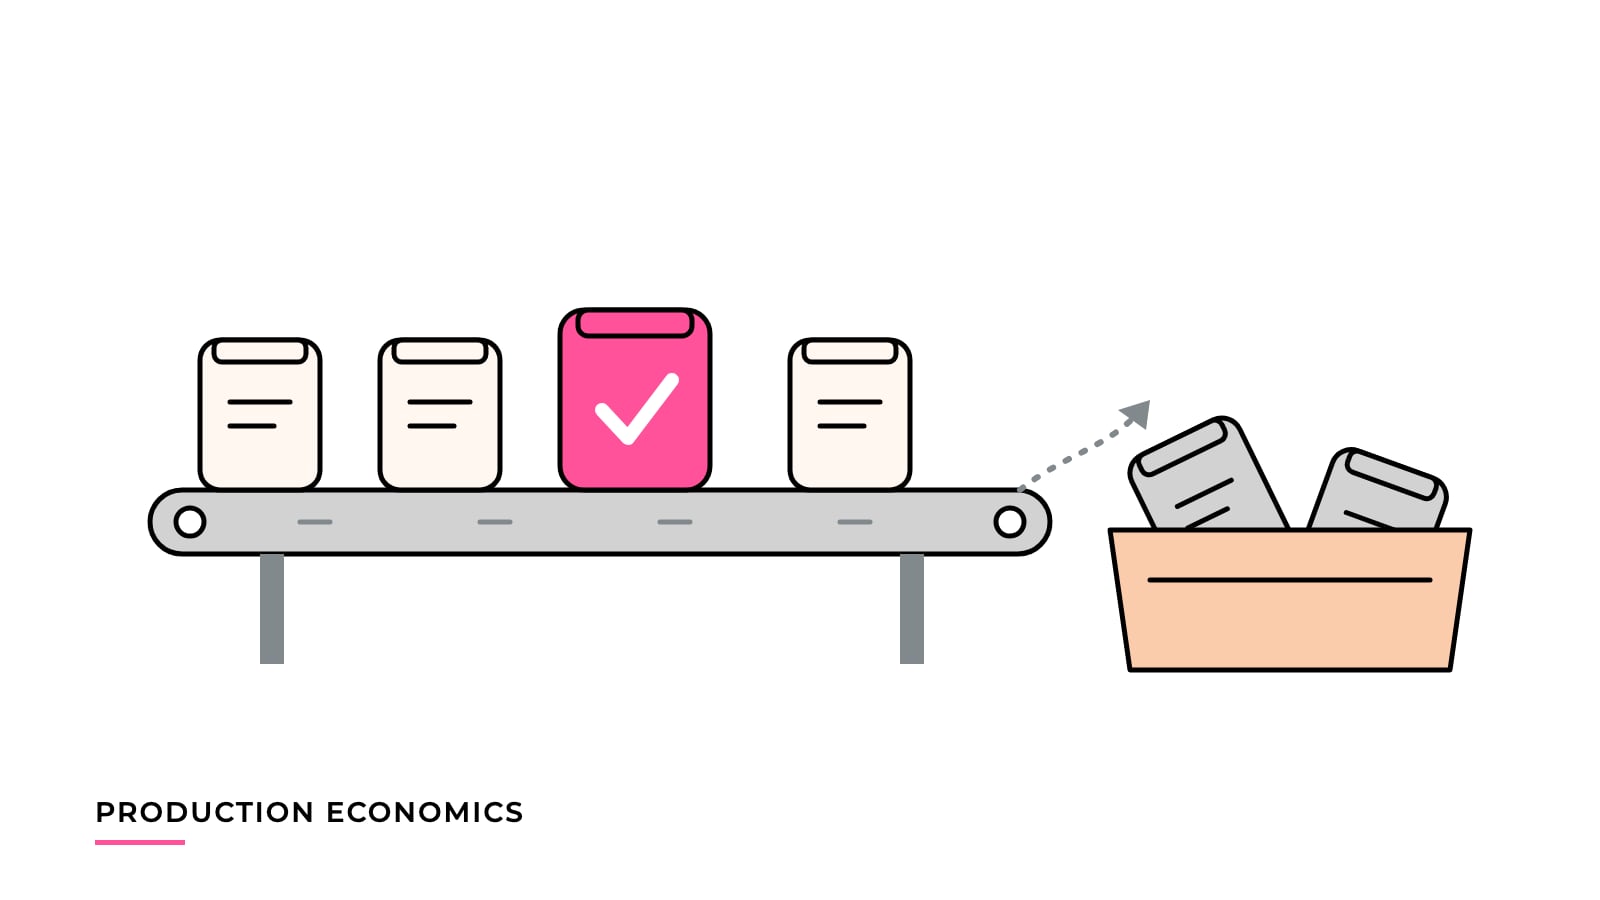
How to define cost per good pack, avoid counting scrap twice, and keep equipment investment as a separate, labeled line, with a one-month worked example.
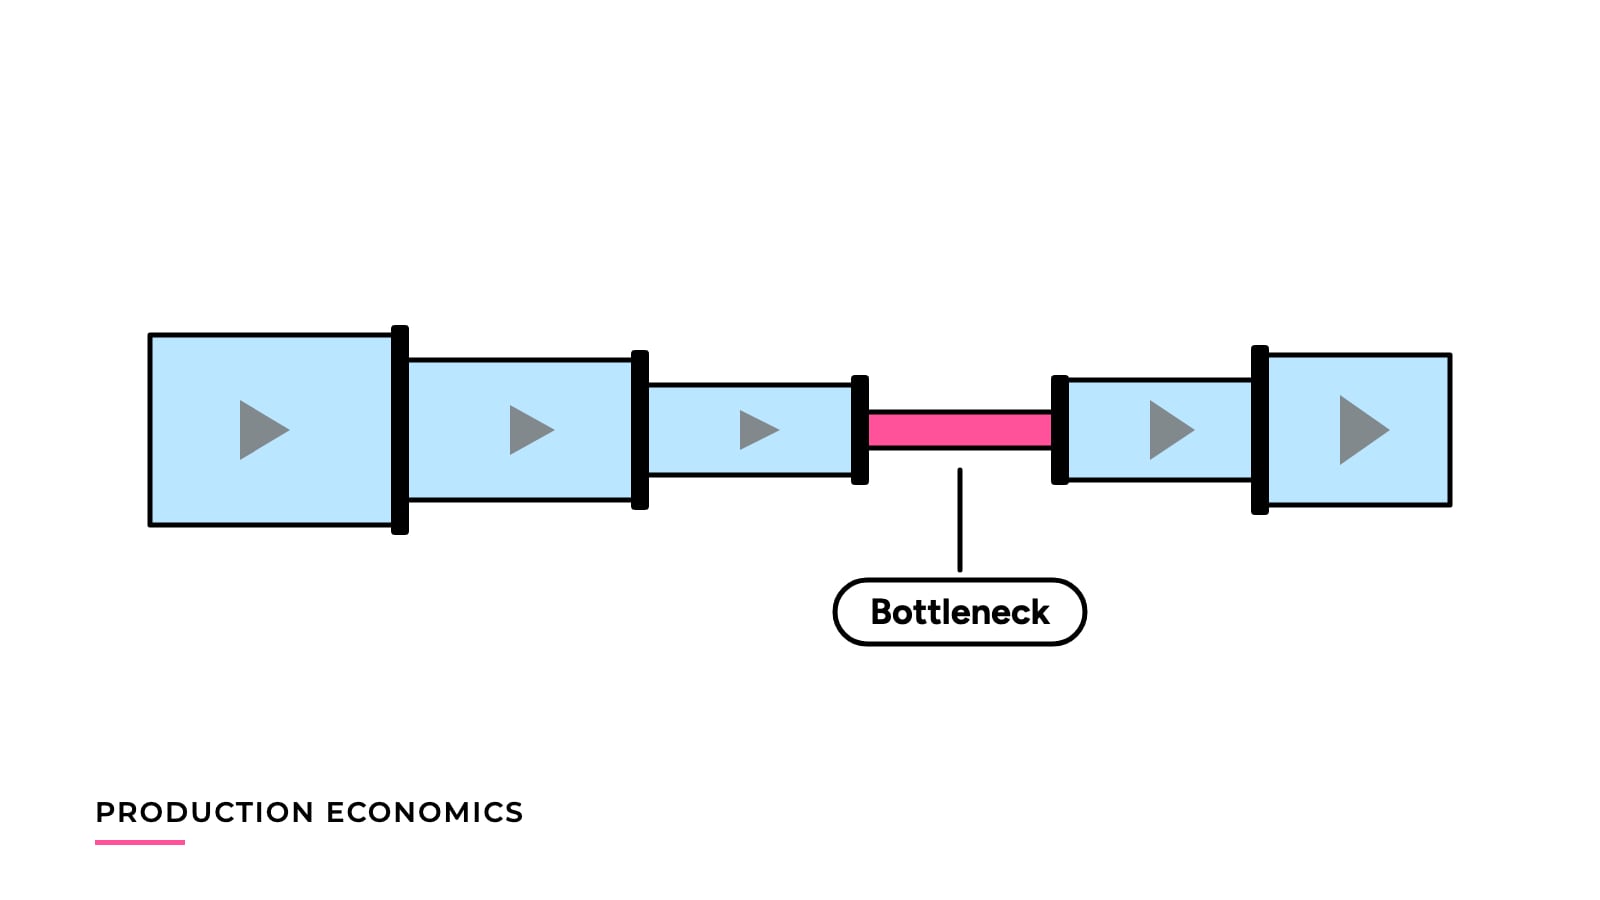
How bottlenecks, availability and good-unit output decide what a packaging line delivers, with a worked four-stage example and a pre-purchase measurement list.