 WonksAnonymous
The 90-Day Post-Installation Review: Did Automation Deliver?
A review template that compares an automation business case with 90 days of actual results, recalculates payback, and records lessons for the next investment.
Most automation gets judged once, before the purchase. The business case is approved, the machine arrives, and nobody goes back to compare the promised results with the real ones. So the plant never learns whether the installation is delivering what the case assumed, or what to change in the line or in the next business case.
About 90 days after the line starts running, hold a review built around a table that puts each business case assumption next to its measured result. Recalculate annual benefit and payback on actual figures, separate one-off problems from structural ones, and file the result with the original case.
Why 90 days
Ninety days is a convention, not a rule. It is long enough to get past the first ramp-up weeks, when operators are still learning and small faults are being fixed, and long enough to see a pattern across several production runs. It is also short enough that the people who wrote the business case still remember its assumptions.
A second review at 12 months makes sense. It captures seasonal volume, a full maintenance cycle and the effect of any fixes made after the first review. The 90-day review is a checkpoint, not a verdict.
Checkpoints from start-up to month 12
The 90-day review is easier when the data it needs has been checked along the way. The schedule below is this site’s editorial recommendation, not an industry standard. Shift it to match your ramp-up, and keep the same order.
Scroll horizontally to see all columns.
| Checkpoint | What to check | Compare with | Don’t conclude yet |
|---|---|---|---|
| Before start-up | Business case frozen and dated; baseline from the old process recorded; counters and downtime log in place | Nothing yet; this is the reference | Anything about results |
| Day 30 | Final invoices for installation, site work and training; open faults and their owners; whether counters, reject counts and the downtime log are being filled in | Planned installed cost I | Productive hours, output per hour or payback, because ramp-up weeks still dominate |
| Day 60 | Weekly trend in productive hours, good output per hour, reject rate, changeover time and unplanned downtime causes; which labor-saving mechanism has started (attrition, ended contract, avoided overtime) | Business case values for each row | Annual B, because weeks before steady running are still a large share of the data |
| Day 90 | The full review table below; B and payback recalculated on both the full-period and steady-weeks readings; one-off and structural variances sorted, with owners and dates | The frozen business case | Seasonal effects and a full maintenance cycle |
| Month 12 | The same table on a full year; seasonal volume; maintenance cost over a full cycle; whether day-90 actions worked | The business case and the day-90 result | Nothing is held back; this is the review to file as the outcome |
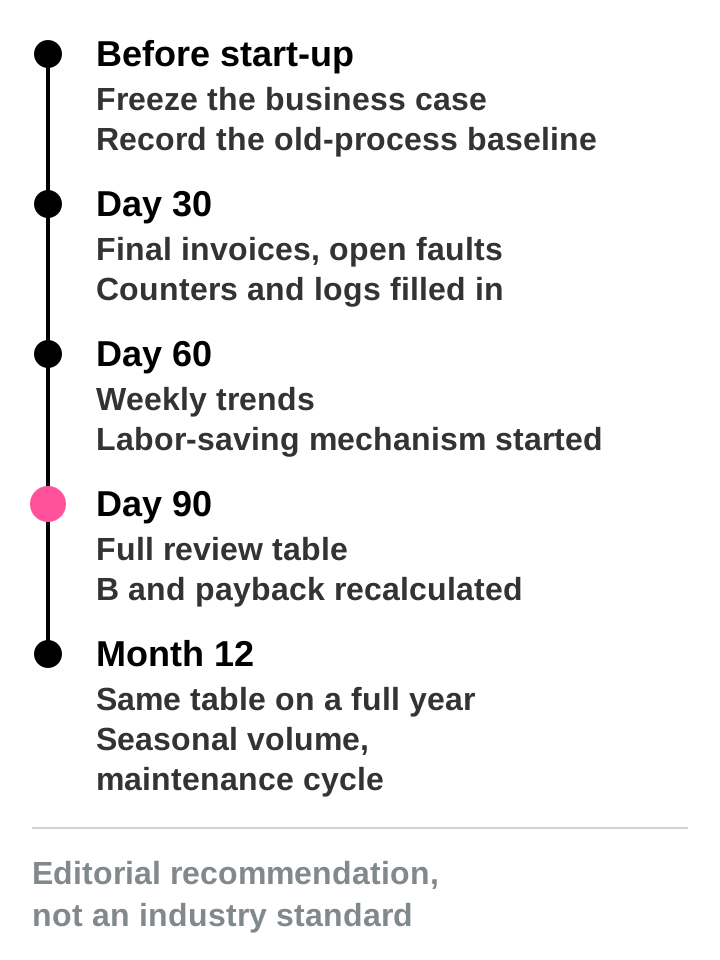
The early checkpoints are short. Their job is to confirm the data is being collected and that installed cost is final, so the 90-day review is not the first time anyone looks. For what each metric in the table means and how payback and ROI differ, see Automation Payback, ROI and TCO.
Prepare before installation
A review only works if two things were recorded before the machine ran. Without them, people compare results with memory, and memory drifts toward whatever is convenient.
First, freeze the business case. Copy the assumptions into a dated document: installed cost I, each component of the annual benefit B, volumes, planned productive hours, labor rates, planned reject rate and planned staffing. Then don’t edit it.
Second, record a baseline from the old process. Measure output per hour, reject rate, changeover time, downtime and the labor actually used, over a few representative weeks. The old process is the reference for “saved”.
The formulas are the same as in the payback, ROI and TCO article.
B = actual cash labor savings
  + other actual cash savings
  + achievable, non-duplicated new contribution
  - new annual cash operating costs

Payback (years) = I / B, only when B > 0
Payback (months) = years x 12
The review table
Use one table with a row per assumption and four columns: business case, actual (90 days, annualized), variance, and a short explanation. The explanation column matters most, because a variance with no cause can’t be acted on.
Scroll horizontally to see all columns.
| Row | What to enter |
|---|---|
| Installed cost | Planned I against the final invoices, including installation, site work and training |
| Productive hours | Hours the machine actually produced, annualized |
| Good output per hour | Good units per productive hour, measured, not the rated speed |
| Reject rate | Rejected units as a share of units made |
| Changeover time | Average minutes per product change, and the number of changes |
| Unplanned downtime | Hours stopped without a plan, and the main causes |
| Labor cash savings realized | Cash that actually stopped leaving the company, with the mechanism: attrition, ended contract or avoided overtime |
| New costs | Maintenance, energy, consumables and technician hours |
| Annual B, recalculated | Components above combined with the B formula |
| Payback, recalculated | I actual divided by B actual, in years and months |
On the labor row, name the mechanism. Hours freed but redeployed are capacity, not cash, as explained in labor savings versus redeployment. If the case claimed a cash saving and nobody can point to a payroll or invoice line that fell, record the full variance.
How to annualize 90-day data
You can’t just multiply thirteen weeks of data by four. The first weeks usually include learning and fixes that won’t repeat, so a straight multiple understates the steady state, while dropping them entirely can flatter the result.
Show both. Report the full 13-week figure annualized, then the figure for the steady weeks (for example weeks 5 to 13) annualized, and say which weeks you excluded and why. Treat ramp-up as a one-off cost rather than part of the annual run rate, but don’t hide it. If a metric is seasonal, say so and wait for the 12-month review.
Worked example
Worked example. Replace each input with a quote or a measured figure from the plant before using the result.
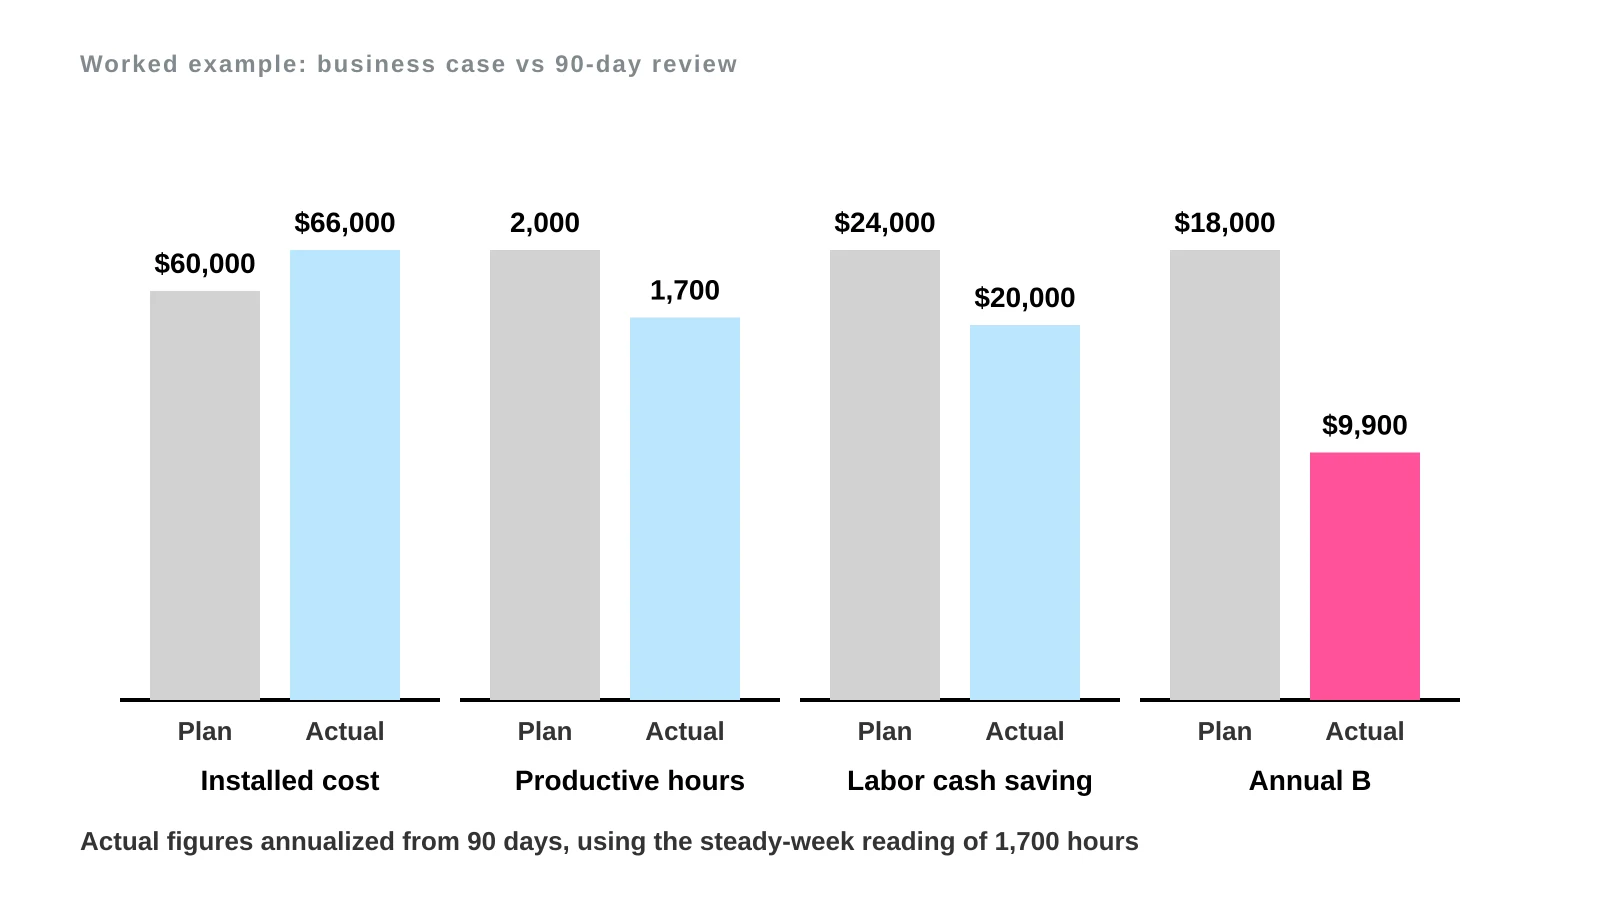
The example reuses the case from the rest of this site: I = $60,000, labor cash savings of $24,000 per year, maintenance and energy of $6,000 per year, so B = $18,000 and payback is 60,000 / 18,000 = 3.33 years, or 40 months. The plan assumed 2,000 productive hours per year. It also assumed 800 freed labor hours at $30 per hour, which is 0.4 labor hours per productive hour (800 / 2,000).
For productive hours, the first four weeks were ramp-up. The machine produced 340 hours in 13 weeks, 294 of them in weeks 5 to 13. Annualized, the full period gives 340 / 13 x 52 = 1,360 hours, and the steady weeks give 294 / 9 x 52 = 1,699, rounded to 1,700. The table uses 1,700. The 1,360 figure appears later as the pessimistic reading.
Scroll horizontally to see all columns.
| Row | Business case | Actual (annualized) | Variance | Explanation |
|---|---|---|---|---|
| Installed cost | $60,000 | $66,000 | +$6,000 (+10%) | Added site work and a delayed start; one-off |
| Productive hours | 2,000 | 1,700 | -300 (-15%) | Slow changeovers and more stoppages than planned |
| Labor cash savings | $24,000 | $20,000 | -$4,000 | One role redeployed, so its wages still count |
| New costs (maintenance, energy, consumables, technician) | $6,000 | $6,500 | +$500 | Higher technician hours during early months |
| Overtime covering lost machine hours | $0 | $3,600 | +$3,600 | 300 shortfall hours x 0.4 x $30 |
| Annual B | $18,000 | $9,900 | -$8,100 (-45%) | Sum of the lines above |
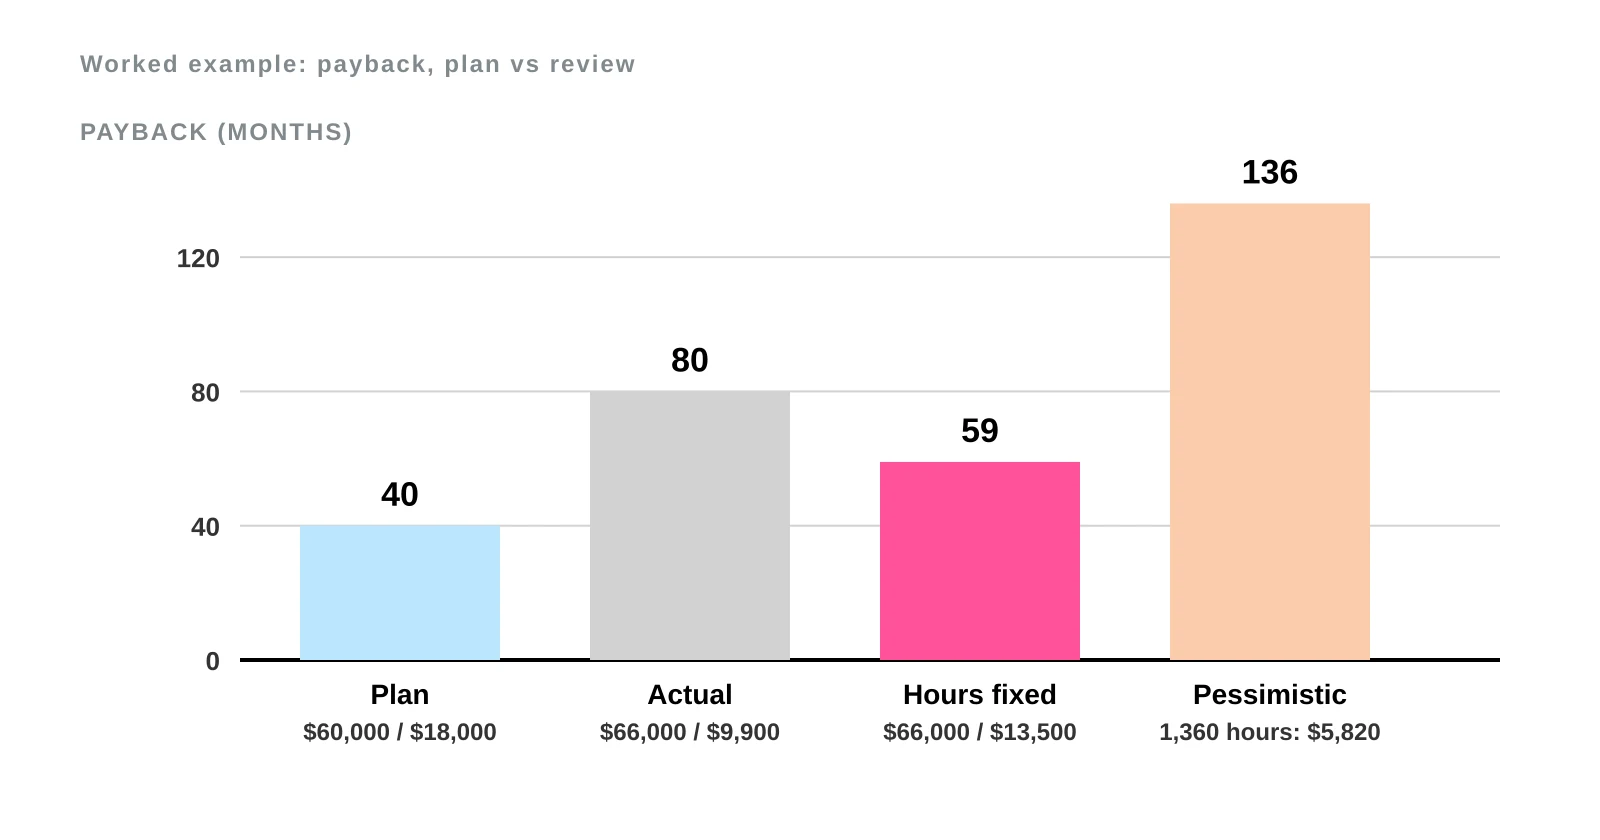
| Payback | 40 months | 80 months | +40 months | See arithmetic below |
The overtime line is the cost of covering the machine’s missing hours by hand: (2,000 - 1,700) = 300 hours, times 0.4 labor hours per productive hour, gives 120 labor hours, times $30, gives $3,600. The $20,000 labor line already reflects the redeployed role, so the two items don’t overlap.
First recalculation, on actual figures:
B = 20,000 - 6,500 - 3,600 = $9,900 per year
Payback = 66,000 / 9,900 = 6.67 years
Payback in months = 6.67 x 12 = 80 months
Checking the B gap: -4,000 (labor) - 500 (new costs) - 3,600 (overtime) = -$8,100, and 18,000 - 8,100 = 9,900.
For a second recalculation, assume the productive hours problem is fixed and the machine reaches 2,000 hours. The overtime line drops to zero and everything else stays at actual values.
B = 20,000 - 6,500 - 0 = $13,500 per year
Payback = 66,000 / 13,500 = 4.89 years
Payback in months = 4.89 x 12 = 59 months
Fixing the hours shortens the payback from 80 to 59 months but doesn’t bring it back to 40. The remaining gap comes from the higher installed cost, the redeployed role and the higher running costs. If you used the full 13-week reading (1,360 hours) instead, the shortfall would be 640 hours and the overtime line 640 x 0.4 x $30 = $7,680. B would be 20,000 - 6,500 - 7,680 = $5,820 and payback 66,000 / 5,820 = 11.34 years, about 136 months. That swing is why you have to state how you annualized.
Reading the variances
Sort each variance into one of two groups.
One-off variances are things like installation delays, a late spare part or a start-up fault that has been repaired. They belong in installed cost or the ramp-up allowance and shouldn’t be projected forward.
Structural variances persist unless something changes: a volume assumption that was wrong, rated speed used in place of measured speed, a labor saving that depends on a role that won’t be cut.
For each structural variance, record an action, an owner and a date. Typical actions are operator training, a maintenance schedule, a production schedule that groups similar products, or a process change upstream. See why faster machines do not always increase line output when the machine is waiting on another station, and measuring the cost of unplanned production downtime when stoppages are the cause.
Lessons for the next business case
The review is also the best input to the next proposal. Write down what the next case should do differently.
- Add a ramp-up allowance, in weeks and in cost.
- Use measured speed from your own line, not rated speed.
- Budget installed cost with site work and training, as in the true installed cost of packaging automation.
- Name the mechanism behind any labor saving, or count the hours as capacity.
- Test the productive hours assumption against order volume, as shown in how equipment utilization changes automation payback.
Who attends, and how to keep it factual
Invite the person who wrote the business case, the finance reviewer, the production or line supervisor, maintenance, and someone who ran the old process. The people closest to the line often know why a number moved.
Keep the meeting blameless. The aim is to explain variances, not to assign fault, and a poor result is still useful information. Bring data rather than opinions, and ask what the record shows before asking why. File the completed table with the original business case so anyone who reads one finds the other.
Results from your own reviews
Results from your own installations are the best data you will have for future decisions, because they reflect your plant, your products and your people. Rerun any worked example on this site, including this one, with measurements from the plant’s own installation.
Keep reading
- How Equipment Utilization Changes Automation Payback: shows how productive hours move payback, useful when the review finds a shortfall.
- Why Faster Machines Do Not Always Increase Line Output: how to check measured speed against line bottlenecks.
- The True Installed Cost of Packaging Automation: lists the cost items that often explain an installed cost variance.
Assumptions and limits
- Replace the review figures with the plant’s own 90-day measurements before comparing them with the original case.
- Annual benefit is treated as steady, so taxes, financing, depreciation and the time value of money are ignored.
- The 90-day window and the choice of ramp-up weeks are conventions, and seasonal products need the 12-month review.
- Reject rate, changeover time and good output per hour are reported but not priced separately in the example, since they act through productive hours here.
- Residual value, useful life and wage growth are left out.
- The review framework is for comparing results with plan and is not financial or engineering advice. The site’s approach to analysis is in the editorial policy.