 WonksAnonymous
Measuring the Cost of Unplanned Production Downtime
Three ways to value an hour of unplanned downtime (lost revenue, lost contribution, recovery cost), when each applies, and a worked 90-minute stop.
Every time a line stops, someone asks what the stop cost. The usual answer multiplies the lost minutes by the line’s rate and the selling price. That figure is too high for most decisions about repairs, spare parts and automation.
A stop has no single cost. There are three ways to value it, and the right one depends on whether the lost output can be made back. Lost revenue is only an upper bound. Lost contribution fits a line that is sold out. Recovery cost fits output you can make up later. Whatever you pick, a cost that occurs either way goes in once.
Three ways to value a stop
Each measure answers a different question, so pick the one that matches what happened to the output.
1. Lost revenue
   = lost packs x selling price per pack

2. Lost contribution
   = lost packs x (selling price - variable cost per pack)

3. Recovery cost
   = extra cost of making the output back
   = overtime labor + extra setup waste + expedited freight + other added cost
Lost revenue almost always overstates the loss. Packs that weren’t made didn’t use film, cartons or product, so those materials weren’t spent. Use it only as an upper bound, for example when a customer asks how much of their order was exposed.
Lost contribution is the right measure when three things hold: the output can’t be recovered later, the stopped line is the constraint on sales, and there is demand for the lost packs. Contribution is what each pack would have added toward fixed costs and profit after its variable cost. For why the constraint matters, see Why Faster Machines Do Not Always Increase Line Output. The same three conditions apply when those hours could make a component or fill another order you already hold: Make or Buy at a Bottleneck: Calculate the Opportunity Cost adds that contribution only up to the orders, and leaves it at zero when the cell still has room.
Recovery cost is the right measure when the output is made up later, by a Saturday shift, a faster second run or a delayed order that still ships. The sale isn’t lost, so the loss is whatever extra it cost to make it.
Costs that occur either way
Some costs belong to the stop whichever measure you use:
- Repair parts and repair labor.
- Scrap created by the stop itself, such as film and packs lost at shutdown and restart.
Idle wages need care. In the example below the crew is paid by the shift whether the line runs or not, so wages are a fixed cost and not part of the variable cost per pack. The wages paid while the crew waits would have been paid without the stop, so they aren’t an extra cost of it under either measure. What the stop adds is the contribution never earned, or the overtime and other costs of making the packs back. Counting idle wages as well charges for the same hours twice.
If your crew is paid per pack, or sent home unpaid during long stops, labor behaves as a variable cost instead. Put it in the variable cost per pack and the contribution figure adjusts.
In short, add a cost only if the stop caused it and no other line in your chosen measure already contains it.
Worked example: a 90-minute stop
Worked example. Replace each input with a quote or a measured figure from the plant before using the result.
A line runs at about 35 good packs per minute, the effective rate used in Cost per Good Pack. It stops for 90 minutes because of an unplanned fault.
lost packs            = 90 min x 35 packs/min = 3,150 packs
selling price         = $1.20 per pack
variable cost         = $0.70 per pack (materials and energy; crew wages are fixed)
contribution per pack = $1.20 - $0.70 = $0.50
repair parts          = $400
scrap from the stop   = $150
The first two measures:
lost revenue      = 3,150 x $1.20 = $3,780
lost contribution = 3,150 x $0.50 = $1,575
For recovery cost, assume the output is made back on a Saturday with a crew of 6 at an overtime rate of $36 per hour (1.5 times a $24 base rate). The 3,150 lost packs take 3,150 / 35 = 90 minutes, or 1.5 hours, of run time. Add 0.5 hour for startup, so the crew is paid for 2 hours. Extra setup waste is $120 and expedited freight to protect the delivery date is $200.
overtime labor  = 2 hours x 6 people x $36 = $432
recovery cost   = $432 + $120 + $200 = $752
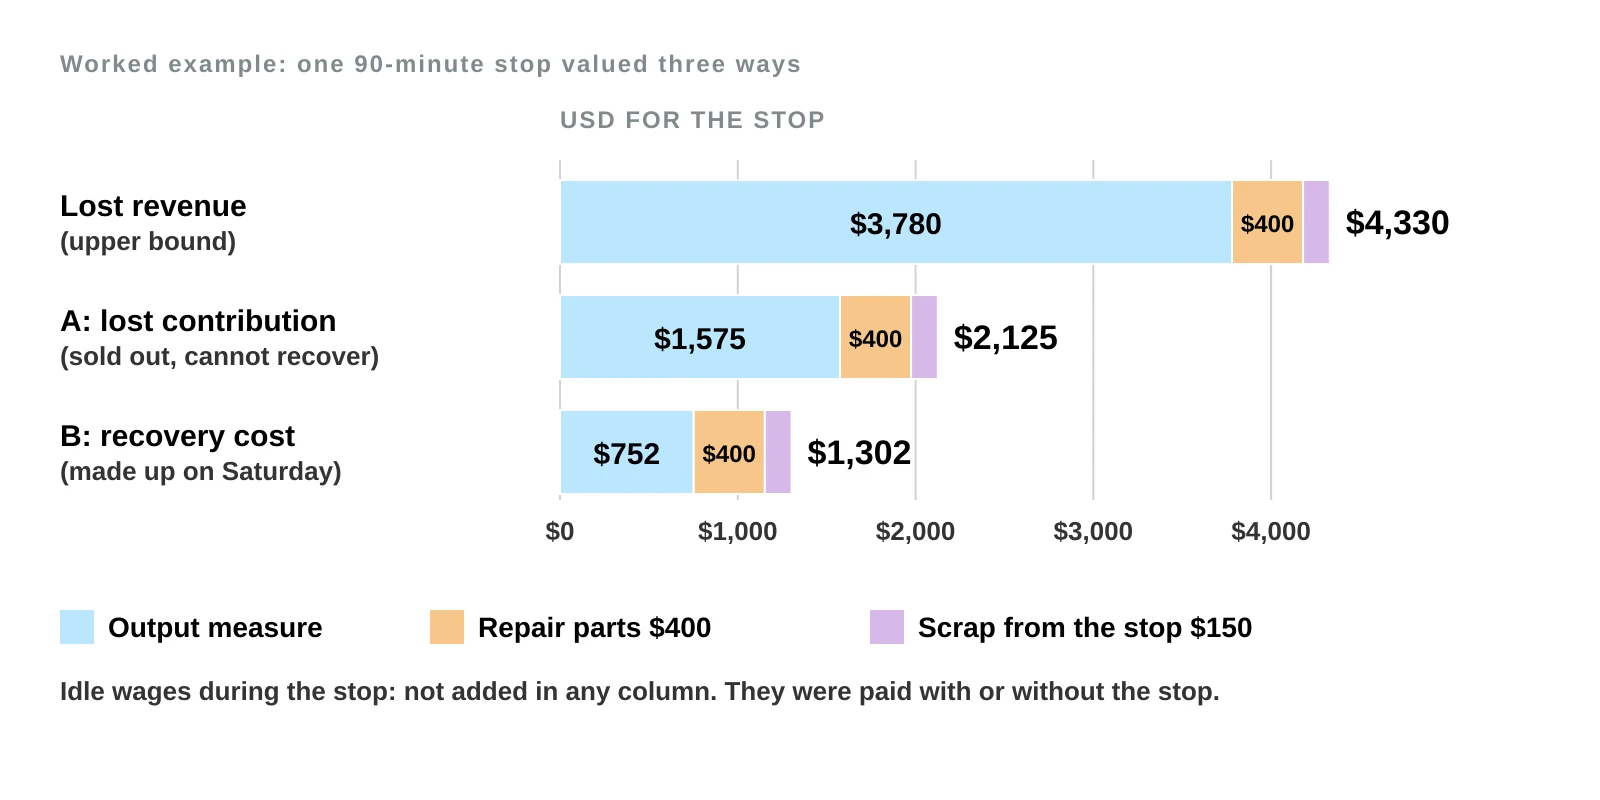
In scenario A the line is sold out and the packs can’t be recovered. Use lost contribution, then add repair parts and scrap. Leave out the idle wages, which were paid with or without the stop.
In scenario B the output is recovered on Saturday. Use recovery cost, then add repair parts and scrap. The Saturday overtime is the labor the stop added. The regular wages paid during the stop ($24 x 6 x 1.5 hours = $216) would have been paid anyway, so they stay out.
Scroll horizontally to see all columns.
| Item | Lost revenue (upper bound) | A: contribution | B: recovery |
|---|---|---|---|
| Output measure | $3,780 | $1,575 | $752 |
| Repair parts | $400 | $400 | $400 |
| Scrap from the stop | $150 | $150 | $150 |
| Idle wages during the stop | not added | not added | not added |
| Total | $4,330 | $2,125 | $1,302 |
The arithmetic: $3,780 + $400 + $150 = $4,330. $1,575 + $400 + $150 = $2,125. $752 + $400 + $150 = $1,302.
On the output measure alone, lost revenue ($3,780) is 2.4 times lost contribution ($1,575) and about 5 times recovery cost ($752). With the common costs included, the same 90-minute stop is worth $4,330, $2,125 or $1,302, depending on the scenario. A plant that always multiplies by the selling price overstates the output loss by 2.4 to 5 times in this example, and the total cost of the stop by roughly two to three times.
Small stops add up
A single breakdown is easy to see. Micro-stops are not, because each one is too short to log.
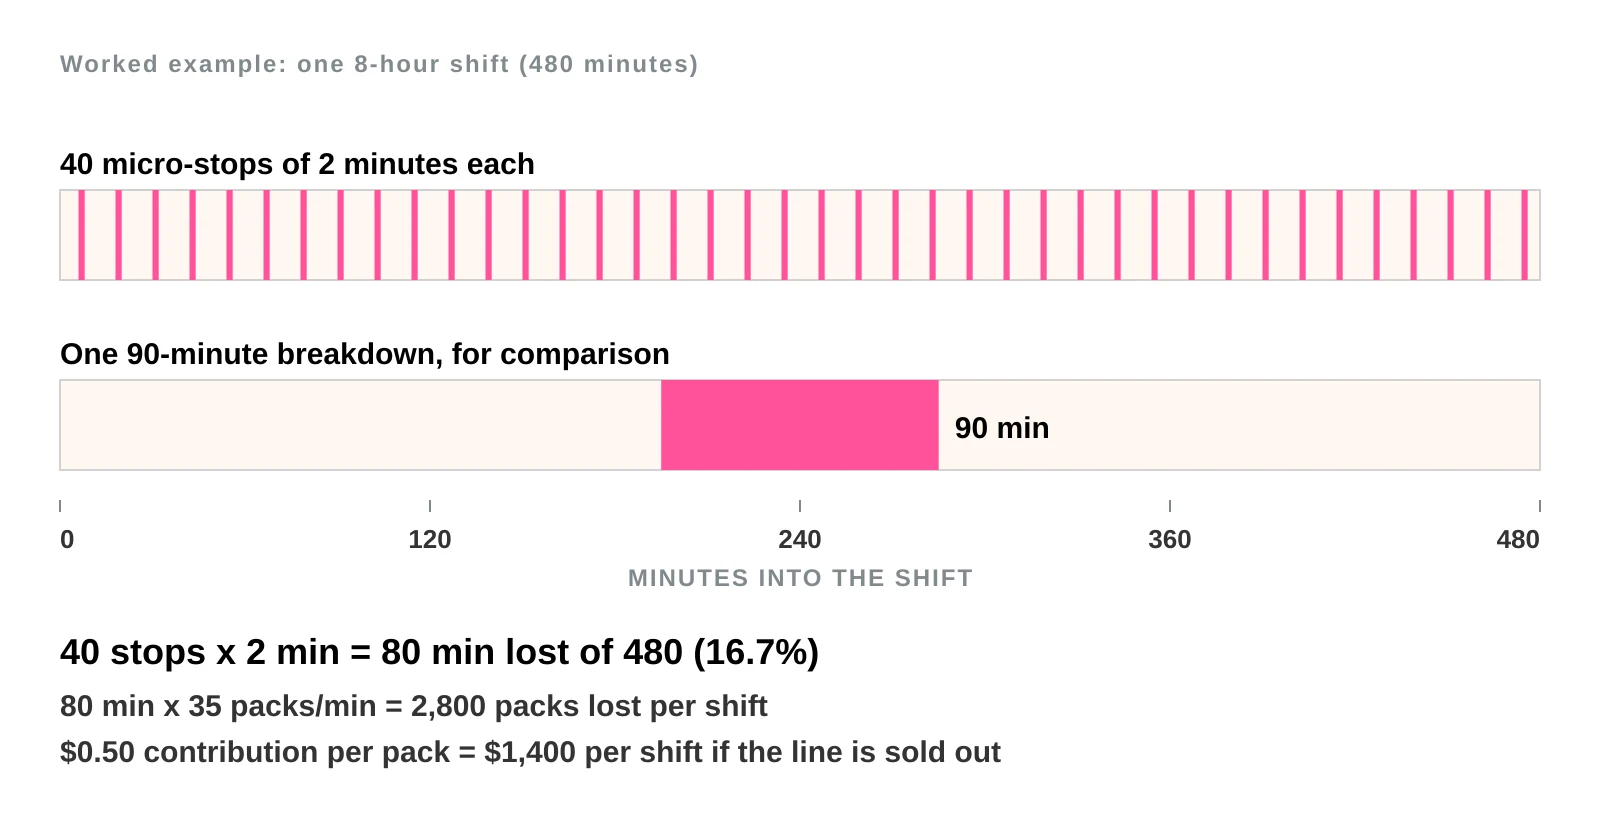
Worked tally for one shift. Replace the stop count with the line’s own log. Suppose a line has 40 stops of 2 minutes each per 8-hour shift.
lost time per shift = 40 x 2 min = 80 minutes
share of shift      = 80 / 480 = 16.7%
lost packs          = 80 x 35 = 2,800 packs per shift
That is less than one 90-minute breakdown per shift, but it happens every shift. Over 22 shifts a month, micro-stops cost 22 x 80 = 1,760 minutes (about 29 hours), against 90 minutes for the one-off breakdown. If the line is the constraint and sold out, 2,800 packs at $0.50 contribution is $1,400 per shift.
Counting these stops takes discipline. If the log only captures stops over 10 minutes, the largest loss may never appear in it.
How to record downtime
Valuing a stop needs a record made while the stop is fresh. Use one row per stop, with the same fields every time:
Scroll horizontally to see all columns.
| Start | End | Stage | Reason code | Planned / unplanned | Packs lost | Recovered (yes/no) | Parts used |
|---|---|---|---|---|---|---|---|
| 09:12 | 10:42 | Case packer | Sensor fault | Unplanned | 3,150 | Yes, Sat. | Sensor, $400 |
| 13:05 | 13:07 | Bagger | Film jam | Unplanned | 70 | No | None |
Packs lost is minutes stopped times the stage’s effective rate. Record the stage, because only a stop at the constraint costs line output. Keep reason codes short and fixed, so a month of rows can be sorted and totaled. After an installation, the same log lets you track downtime against the business case; see The 90-Day Post-Installation Review.
How it feeds decisions
For maintenance spending, compare the cost of preventing a stop with the value of that stop under the right measure. A fix that saves 2,800 packs a shift is worth $1,400 per shift in contribution if the line is sold out, and far less if the output would have been recovered.
A spare part is worth stocking when the expected cost of waiting for it exceeds the carrying cost. Lead times matter most for imported parts; see Imported Equipment Costs Beyond the Factory Price. A stop that lasts weeks while you wait for a part is mostly a lost-contribution problem if recovery isn’t possible.
In an automation business case, don’t count “downtime savings” at selling price. Use contribution if the line is sold out, or the avoided recovery cost if it isn’t, and count each once. Automation Payback, ROI and TCO compares the metrics.
When the choice changes
- The line is not the constraint. A stop at a stage with idle capacity downstream or upstream may cost little output, because the buffer or spare capacity absorbs it.
- Demand is soft. If you weren’t going to sell the lost packs, the contribution loss is near zero, even though the “lost” revenue looks large.
- The output is partly recoverable. Split the lost packs: some made back (recovery cost), some not (lost contribution).
- Customers cancel or penalize late delivery. Then penalties and lost future orders belong in the loss, and none of the three measures above includes them.
More on the topic is collected under Production Economics.
Keep reading
- Why Faster Machines Do Not Always Increase Line Output: shows which stage sets line output, which decides whether a stop costs anything.
- Imported Equipment Costs Beyond the Factory Price: covers lead times and spare parts, which set how long a stop can last.
- Automation Payback, ROI and TCO: What Each Metric Tells You: explains how to place downtime savings into a payback calculation.
Assumptions and limits
- The price, variable cost, wage and crew size are example values; yours will depend on the plant and the product.
- The line is assumed to run at a constant 35 good packs per minute, and the lost packs are valued at that rate.
- Taxes, financing, the time value of money and longer-term customer effects are ignored.
- Scenario B assumes the Saturday crew is available and that every recovered pack sells at the normal price.
- Maintenance, safety and engineering decisions need their own review. Use this to compare ways of valuing a stop, not as financial or legal advice.