 WonksAnonymous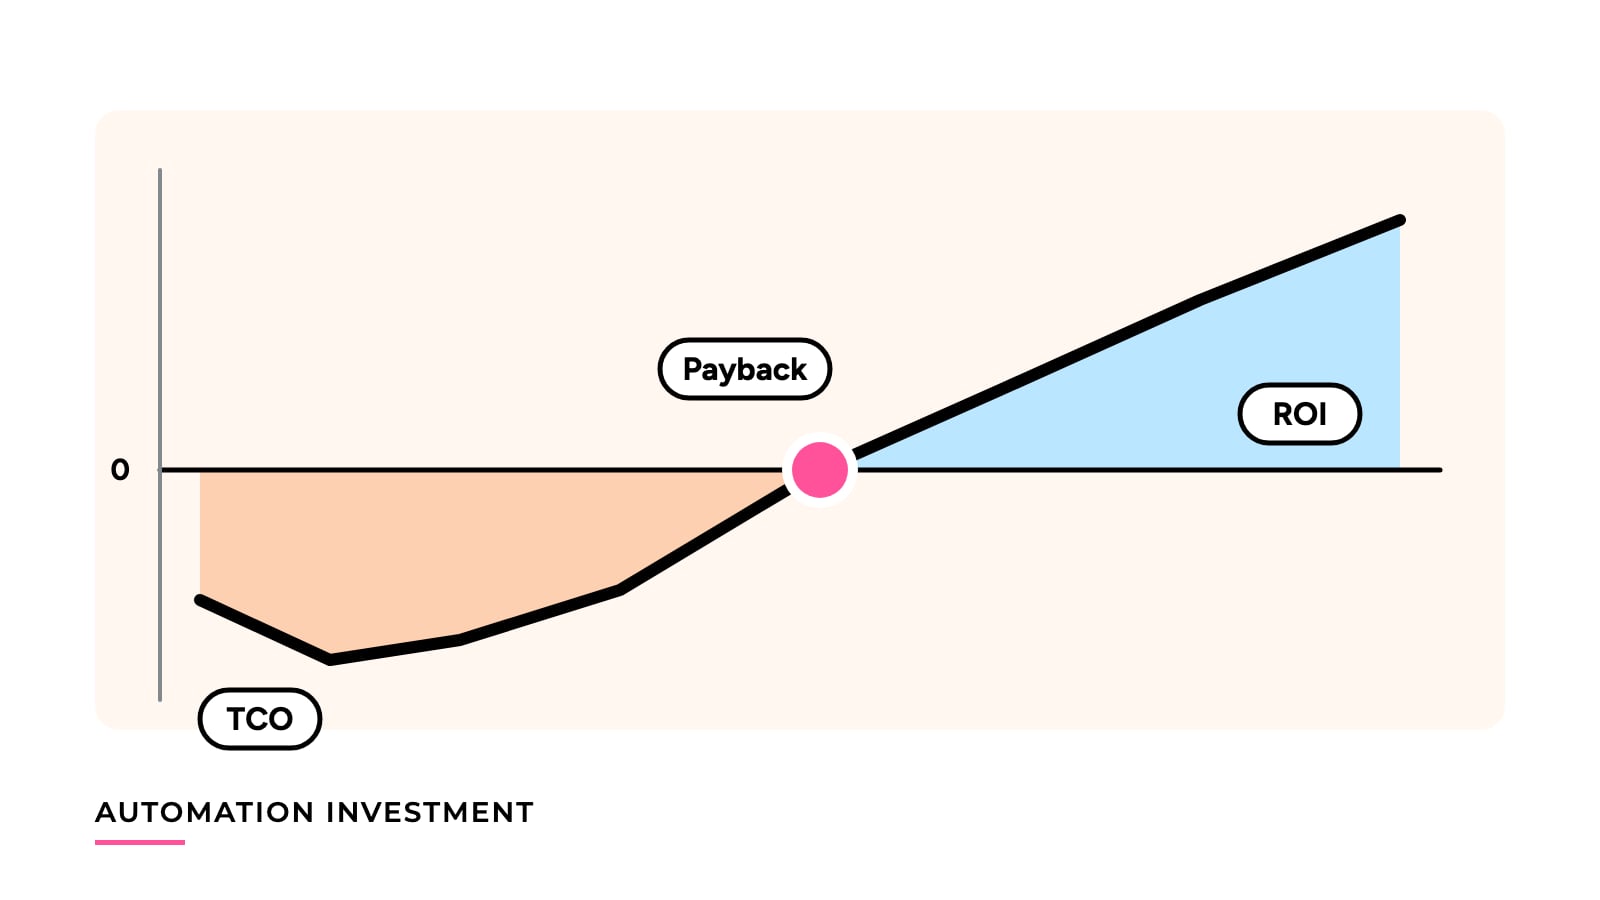
Automation Payback, ROI and TCO: What Each Metric Tells You
Payback, ROI and TCO answer three different questions. One worked automation case run through all three, with what each metric leaves out.
A proposal that quotes “a 40-month payback” or “50% ROI” is answering one question and leaving the other two unasked. The three metrics get used as if they were interchangeable, and a proposal that quotes one without saying which question it answers can look stronger or weaker than it is.
Payback tells you how long the cash is at risk. ROI tells you how much you gain over a stated horizon. TCO tells you what an option costs in total, so you can set it beside another option. The case below runs through all three on the same numbers, so you can see where each one goes quiet.
What automation ROI means
ROI stands for return on investment. Automation ROI is not a separate formula: it is the ordinary ROI ratio applied to an automation project, net gain over a stated period divided by what was invested.
ROI = (total net benefit over N years - I) / I
What is specific to automation is what goes into the two inputs. I is the full installed investment, not the machine price. The benefit is the annual cash benefit B, built from the changes the machine actually causes (labor cash that stops, material no longer wasted, contribution from extra output that can be sold) minus the new running costs it brings. Most bad ROI figures come from those inputs, not from the division.
To calculate it for one project:
- Total the installed investment I: equipment, necessary freight, installation, modifications and training.
- List each benefit type separately and keep only cash that actually changes (see “Which benefits belong in B” below).
- Subtract new annual cash operating costs to get B.
- Pick a horizon N and state it next to the result, ideally no longer than the period you expect the machine to stay useful.
- Compute ROI, then compute payback from the same inputs, because the two together say more than either alone.
For the case below, those steps give I = $60,000, B = $18,000 per year and an ROI of 50% over five years. Each step is shown in the sections that follow.
The case used throughout
Worked example. Replace each input with a quote or a measured figure from the plant before using the result.
A plant is considering a machine that replaces part of a manual task. The inputs:
Scroll horizontally to see all columns.
| Item | Amount |
|---|---|
| Up-front installed investment (I) | $60,000 |
| Cash labor savings per year | $24,000 |
| New maintenance and energy per year | $6,000 |
| New order contribution | $0 |
“Installed” means everything needed to get the machine producing: equipment, necessary freight, installation, modifications and training. If you have only the equipment price, you do not yet have I. The article on the true installed cost of packaging automation lists what usually sits outside the machine quote.
Simple payback
Simple payback is the number of years of steady annual cash benefit it takes to recover the up-front investment.
I = equipment + necessary freight + installation + modifications + training

B = actual cash labor savings
  + other actual cash savings
  + achievable, non-double-counted new contribution
  - new annual cash operating costs (maintenance, energy, consumables)

Payback (years) = I / B, only when B > 0
Payback (months) = payback in years x 12
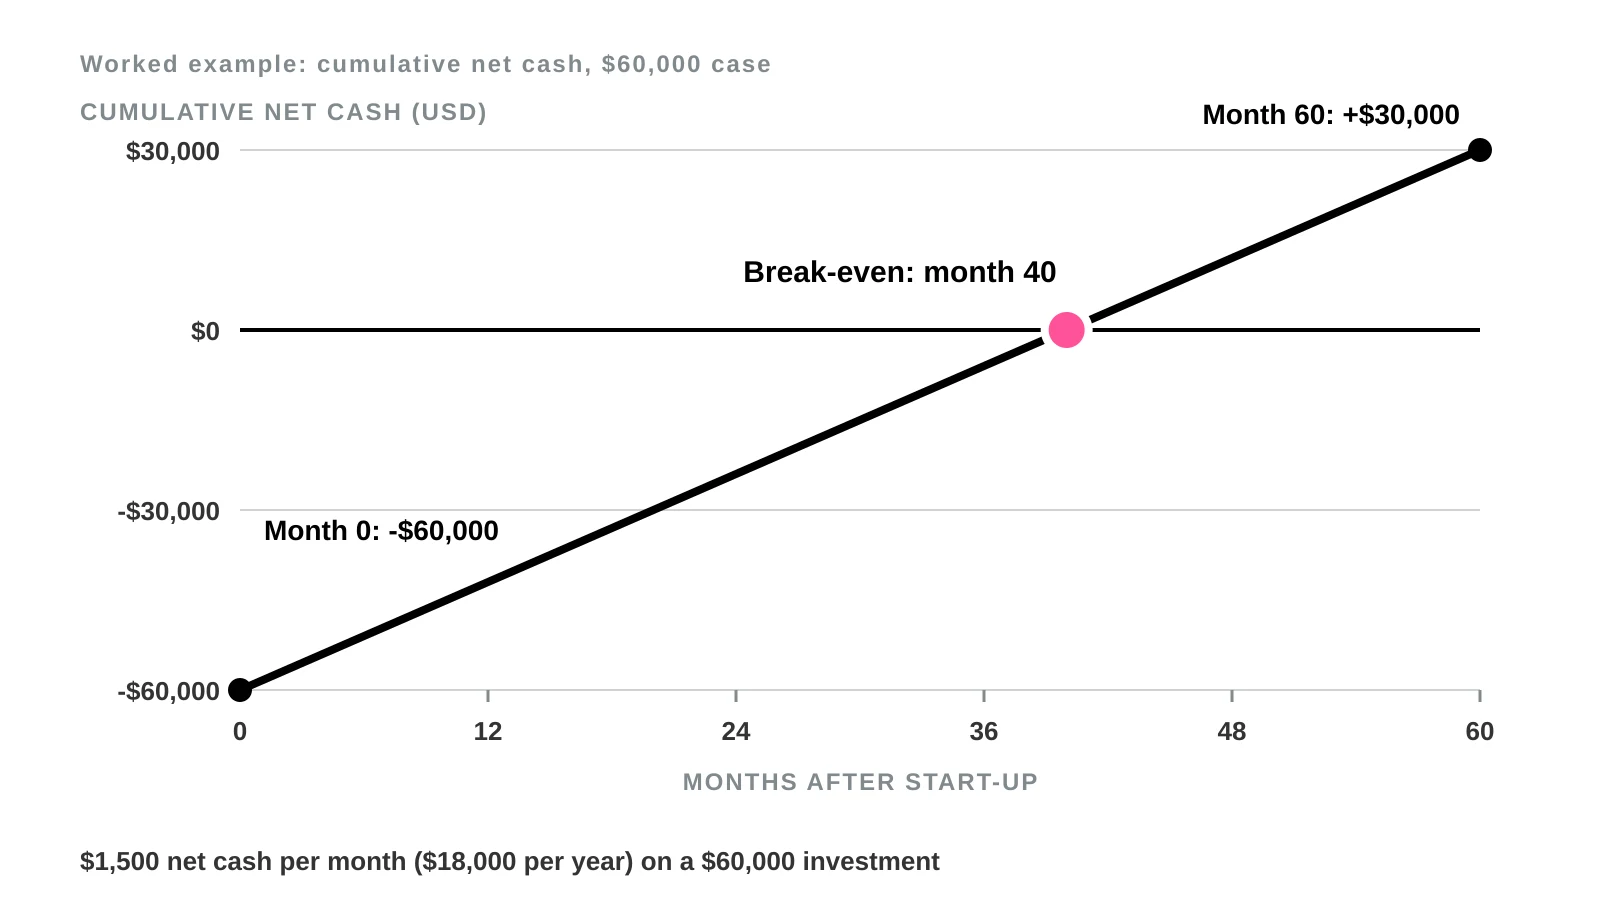
For the case: B = 24,000 + 0 + 0 - 6,000 = $18,000 per year. Payback = 60,000 / 18,000 = 3.33 years, or about 40 months (3.33 x 12 = 40).
If B is zero or negative, there is no payback to report. Say that the model gives no positive payback, rather than printing “0 years” or a negative number of years.
Payback says nothing about what happens after break-even. A 40-month payback looks the same whether the machine lasts 4 years or 14. It also treats a dollar in year 3 as equal to a dollar today, and it assumes B is the same every year. Real results often drift from the plan, which is why a 90-day post-installation review recalculates B from measured figures.
Which benefits belong in B
Automation benefits usually fall into four types. Each one enters B through a specific term, and each has its own way of being overstated.
Scroll horizontally to see all columns.
| Benefit type | Where it enters B | Counts only when | Common overstatement |
|---|---|---|---|
| Labor | Actual cash labor savings | Wages, overtime or contract labor actually stop | Hours freed but redeployed, so wages are still paid |
| Scrap and material | Other actual cash savings | Material purchases fall because fewer packs are rejected or less is given away | Adding a scrap saving that is already inside a lower material cost per unit |
| Capacity | Achievable, non-double-counted new contribution | Extra good output can be sold, at contribution (price minus variable cost), not revenue | Valuing extra capacity at full sales price, or counting it when demand is not there |
| Downtime | Labor or new contribution, depending on what the stop cost you | Fewer stops reduce overtime, or add good output that sells | Counting the same lost hours once as downtime and again as lost output |
In the case used here, only the labor type is non-zero: $24,000 of cash labor savings, $0 of new contribution, and $6,000 of new maintenance and energy. If a proposal adds scrap, capacity or downtime benefits to a case like this, ask which line of B each one sits in and what record supports it. How downtime should be valued is covered in measuring the cost of unplanned production downtime. Rejects and stoppages also raise unit cost by lowering the count of sellable output, which the cost per good pack article listed under Keep reading works through.
ROI needs a horizon
ROI compares total net benefit with the investment. A percentage with no time period attached can’t be read, because 50% over two years and 50% over ten years are very different results.
Total net benefit over N years = N x B
ROI = (total net benefit - I) / I
For the case, choose a 5-year horizon. Total net benefit = 5 x 18,000 = $90,000. ROI = (90,000 - 60,000) / 60,000 = 0.50, or 50% over five years.
Change the horizon and the answer changes. At 3 years, total net benefit is 3 x 18,000 = $54,000 and ROI = (54,000 - 60,000) / 60,000 = -10%. Same machine, same inputs, but the sign flips because 3 years is shorter than the payback period.
Simple ROI also ignores timing. A project that earns its benefit early and one that earns it late can show the same percentage. And it says nothing about the machine’s useful life unless you pick the horizon to match it.
TCO compares options
Total cost of ownership adds up what an option costs over a stated life. It measures cost, not return, and it only helps when you set it beside another option.
TCO = acquisition + installation + operating + maintenance
    + downtime and ramp-up costs + end-of-life costs
    - residual value
    (over a stated life)
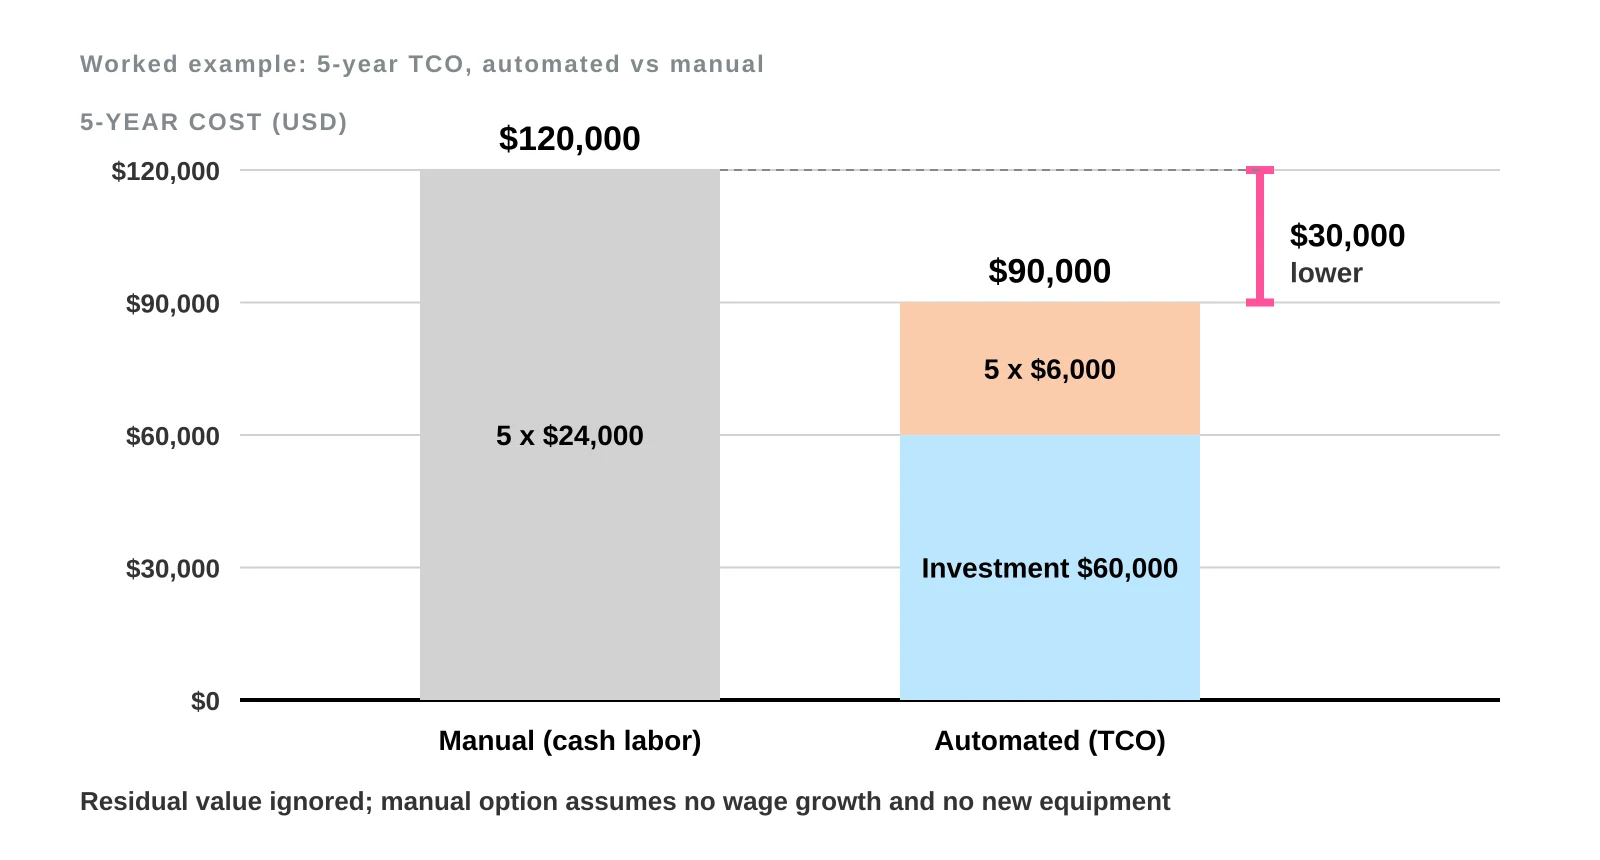
For the automated option, use a 5-year life. Acquisition and installation are already inside I, and operating and maintenance cost $6,000 per year. Residual value is ignored here to keep it simple. TCO = 60,000 + 5 x 6,000 = $90,000.
That number means little alone, so price the alternative of staying manual. The replaced labor costs $24,000 per year in cash, so over five years the manual option costs 5 x 24,000 = $120,000 (this assumes no new equipment and no wage growth). The automated option costs $90,000. The $30,000 difference favors automation and matches the ROI numerator above (90,000 - 60,000 = 30,000). The three metrics are one set of cash flows seen from different angles. For a comparison across manual, semi-automatic and automatic options at different volumes, see the packaging cost model.
TCO leaves out the benefit side. A lower TCO doesn’t show that the option produces the volume you need, and a TCO that omits downtime, ramp-up or end-of-life costs flatters whichever option is being sold.
Side by side
Scroll horizontally to see all columns.
| Metric | Question it answers | Formula | What it hides |
|---|---|---|---|
| Simple payback | How long until the investment is recovered? | I / B, when B > 0 | Cash flows after break-even, useful life, timing within the period |
| ROI | How much do we gain relative to what we put in, over a stated horizon? | (N x B - I) / I | Timing of benefits, and meaningless without N |
| TCO | What does each option cost in total over its life? | Acquisition + installation + operating + maintenance + downtime + end-of-life - residual value | Benefits and output; it ranks costs only |
For the case, that is a payback of 3.33 years (about 40 months), an ROI of 50% over 5 years, and a 5-year TCO of $90,000 against $120,000 of manual cash cost.
Where NPV and IRR fit
Net present value (NPV) and internal rate of return (IRR) discount future cash flows to account for the time value of money. Simple payback doesn’t, so don’t label it NPV or IRR, and don’t present a simple ROI as a discounted return.
If a project has uneven cash flows, a ramp-up period, financing or tax effects, build a fuller model. The simple formulas here are a first screen that tells you whether a project is worth that effort. When the annual cash changes by year, including a year whose net cash is negative, use Build a Multi-Year Equipment Cash-Flow Model in Excel.
ROI compared with profit, revenue, cost savings, ROR and ROIC
These measures get mixed in business cases because several of them are percentages and all of them sound like “return”. They measure different things over different bases. The table runs each one on the same case: I = $60,000, $24,000 per year of cash labor savings, $6,000 per year of new running costs, no new sales.
Scroll horizontally to see all columns.
| Measure | What it measures | Formula | The case | Question it answers |
|---|---|---|---|---|
| Cost savings | Gross cash that stops leaving the business | Sum of cash costs removed | $24,000 per year | How much spending goes away? Not a return, because it ignores I and new costs |
| Revenue increase | Extra sales | New sales value | $0 | Does the project sell more? Revenue is not a return; only the contribution from it can enter B |
| Net annual cash benefit (B) | Cash benefit after new running costs | Savings + contribution - new running costs | $18,000 per year | What does the project add each year in cash? |
| Profit effect (pre-tax) | Change in accounting income, after depreciation | B - annual depreciation | 18,000 - 12,000 = $6,000 per year | How does reported profit change? |
| ROI (simple) | Net gain relative to investment over N years | (N x B - I) / I | 50% over 5 years | How much do we gain for what we put in, over this horizon? |
| Rate of return, annualized | ROI restated per year | (1 + ROI)^(1/N) - 1 | 8.4% per year | What yearly rate equals that total gain? |
| IRR | Discount rate at which the project’s NPV is zero | Solve NPV = 0 | About 15.2% | What yearly return do these timed cash flows earn? |
| Accounting rate of return | Income relative to investment | (revenue and savings - expenses incl. depreciation) / I | 6,000 / 60,000 = 10% | How much extra income per dollar invested? |
| ROIC | Return on all capital in the business | After-tax operating income / invested capital | Company ROIC not calculated here | Does the whole business earn more than its capital costs? |
Depreciation in this example is straight-line over 5 years with no residual value, and taxes are left out. The example treats the entire $60,000 as depreciable; capitalized cost can differ from total installed cash outlay.
Three distinctions matter most in practice.
Profit and ROI are not the same thing. A project can raise accounting profit by $6,000 a year and still have a negative ROI over a short horizon, as the 3-year figure above shows. The profit line spreads the investment as depreciation; ROI sets the whole investment against the whole benefit.
Rate of return (ROR) is a family of measures, not one number. In finance textbooks the basic form is the holding period return, the gain over a period divided by the starting value, and it is annualized with (1 + return)^(1/years) - 1. Applied to this case, 50% over five years is 8.4% a year. That figure treats all the gain as arriving at the end. Because the case actually earns $18,000 each year, its IRR is higher, about 15.2%. When someone quotes “the rate of return” on an automation project, ask which of these they mean.
Company ROIC divides after-tax operating income by invested capital. A project can also be assessed on an incremental return-on-capital basis, but this example does not calculate that measure: it leaves taxes and changes in invested capital over time out of the model. To assess the company’s resulting ROIC, estimate the project’s incremental after-tax operating income and invested capital on the same accounting basis as the existing business. This article does not cover ROIC benchmarks, which depend on the industry and on accounting choices.
Common mistakes
Counting redeployed staff as cash savings is the most common error. If the person moves to another job, wages still get paid, and only labor cash that actually stops belongs in B. See labor savings versus redeployment.
Using nameplate speed as output is the second. A rated speed isn’t a delivered volume; bottlenecks and stoppages decide the real number, as in why faster machines do not always increase line output.
Three smaller ones:
- Using the equipment price as I understates the investment and shortens payback on paper.
- If a benefit is already netted into a unit contribution, don’t add it again as a separate saving.
- Quoting a payback from one scenario and a TCO from another gives a comparison no one can reproduce.
Each error, corrected
The error rows reuse the $60,000 case and change one input at a time.
Scroll horizontally to see all columns.
| Error | Input used | Corrected input | Payback reported | Payback corrected |
|---|---|---|---|---|
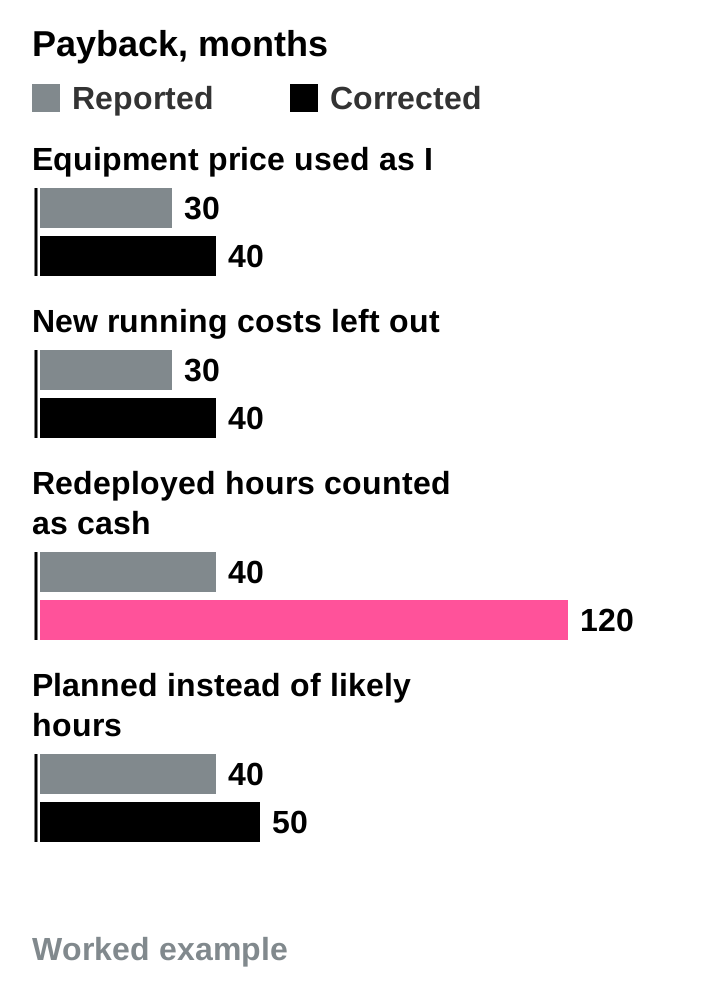
| Equipment price used as I | I = $45,000 (machine only; $15,000 of freight, installation and training left out) | I = $60,000 | 30 months | 40 months |
| New running costs left out | B = $24,000 | B = 24,000 - 6,000 = $18,000 | 30 months | 40 months |
| Redeployed hours counted as cash | B = $18,000, where $12,000 of the labor saving is hours moved to other work | B = 12,000 - 6,000 = $6,000 | 40 months | 120 months |
| Planned hours used in place of likely hours | Labor saving for 2,000 productive hours, B = $18,000 | Labor saving for 1,700 hours: 24,000 x 0.85 - 6,000 = $14,400 | 40 months | 50 months |
| ROI quoted with no horizon | “50% ROI” | 50% over 5 years; -10% over 3 years | Can’t be read | Readable only with N |
Each corrected figure uses the formulas in the sections above. The errors also stack: a proposal that leaves out running costs and counts redeployed hours as cash reports 30 months for a project that, on these inputs, takes 120.
Check the assumptions before you buy
Most of these inputs can be checked before a purchase order is signed.
- Installed cost: ask for every item between the quote and a producing line, and price the ones the quote leaves out.
- Productive hours: take them from your own order book and shift pattern, not from the hours the machine could run.
- Good output per hour: run a trial on your own product and material. A supplier’s test figure describes that test, on that product, under those conditions, which is how this site treats quotes and test data in our models.
- Labor saving: name the payroll line, contract or overtime budget that falls, and when.
- Running costs: list maintenance, energy, consumables and technician time per year.
- Horizon: state N and check that it is not longer than you expect the machine to stay useful.
Then rerun payback and ROI with the cautious version of each input. If the project only works with every input at its best value, that is the finding.
Keep reading
- ROI Calculation in Excel: Simple ROI, Discounted Payback, NPV, XNPV, IRR, and MIRR for Equipment CapEx: compares simple ROI against NPV, XNPV, IRR, XIRR, and MIRR when a $500,000 machine has milestone deposits, Q1 ramp-up scrap, a Year 5 overhaul, and 7-year MACRS depreciation.
- Build a Multi-Year Equipment Cash-Flow Model in Excel: year-by-year cash, a negative overhaul year, and an NPV that leaves the opening outlay outside Excel’s NPV function.
- How Equipment Utilization Changes Automation Payback: the same $60,000 case, moved by fewer or more productive hours.
- Cost per Good Pack: A More Useful Measure Than Nameplate Speed: ties output quality to the benefit side of B.
- Labor Savings Versus Redeployment: Avoiding False Payback Claims: separates labor savings that are cash from hours that are merely freed.
Assumptions and limits
- Annual benefit B is the same every year, with no ramp-up or learning curve.
- Taxes, financing, depreciation and the time value of money are left out, so none of these figures is an NPV or IRR.
- Residual value and end-of-life costs are not in the worked TCO. Add them when they are material.
- The manual comparison holds labor cost flat, with no wage growth.
- Replace every input with the plant’s verified quotes and measured figures before using the payback.
- The profit effect and accounting rate of return use straight-line depreciation over 5 years and are pre-tax. The IRR assumes end-of-year cash flows.
- The models are for comparing options and are not financial, legal, safety or engineering advice. The site’s approach to analysis is in the editorial policy.
Sources
- OpenStax, Principles of Finance, 15.1 Risk and Return to an Individual Asset (holding period return and annualizing a return)
- OpenStax, Principles of Accounting, Volume 2, 11.2 Evaluate the Payback and Accounting Rate of Return in Capital Investment Decisions (payback and accounting rate of return as non-time-value methods)
- Aswath Damodaran, NYU Stern School of Business, Return on Capital (ROC), Return on Invested Capital (ROIC) and Return on Equity (ROE): Measurement and Implications, July 2007 (definition of return on invested capital)