 WonksAnonymous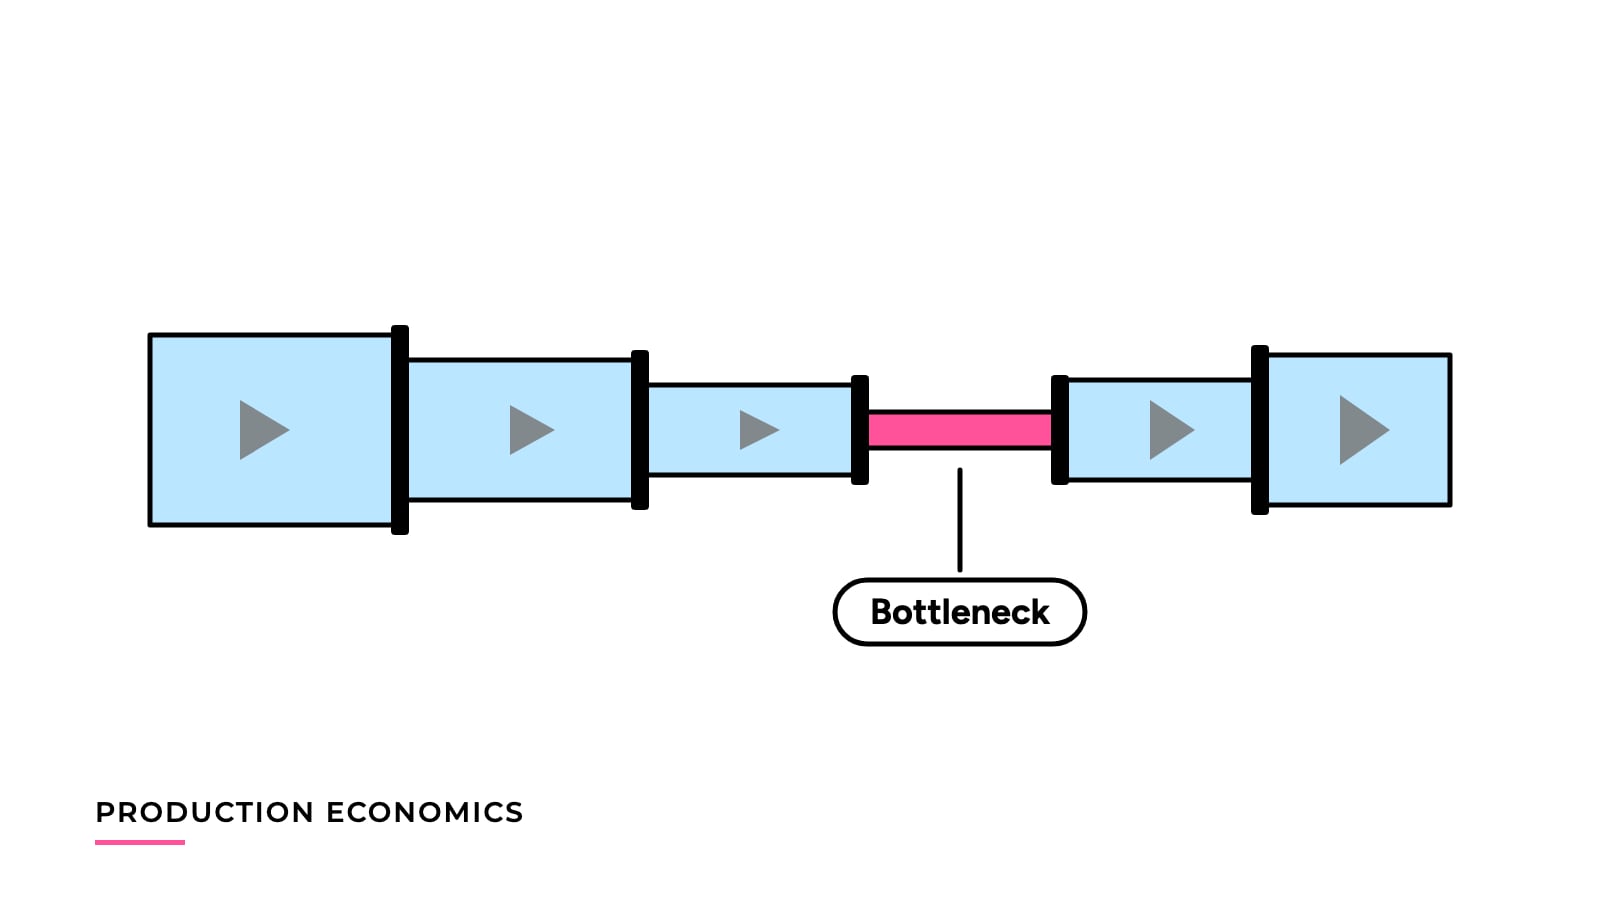
Why Faster Machines Do Not Always Increase Line Output
How bottlenecks, availability and good-unit output decide what a packaging line delivers, with a worked four-stage example and a pre-purchase measurement list.
You bought, or are thinking of buying, a faster machine because the line is not shipping enough. Whether that helps depends on where in the line the machine sits, and whether it raises what the line ships or only a number on a specification sheet.
A line delivers what its slowest stage delivers in practice, not what its fastest machine can do on paper. A faster machine helps only if it is the stage that limits the line, or if it also makes that stage run more reliably. Otherwise the extra speed turns into waiting time.
A line is a chain
Take a typical packaging line. A bagger fills and seals packs, a checkweigher rejects under- and overweight packs, a case packer loads packs into cases, and a palletizer stacks the cases. Each stage hands product to the next. Over a full shift, no stage can pass on more than it receives, and none can ship more than the one behind it can accept.
So line output is a minimum, not an average. If one stage can only process 36 good packs a minute over a shift, the line makes about 36 good packs a minute, however fast the others are rated.
What effective rate means
Nameplate speed is the rated speed under good conditions. What a stage actually delivers over planned time is lower. One common way to break down the gap is to multiply three factors on top of rated speed, the same components used in overall equipment effectiveness (OEE).
effective rate = rated speed x availability x performance x quality

availability = share of planned time the machine is actually running
performance  = actual speed while running / rated speed
quality      = share of output that is good on the first pass
Availability falls with breakdowns, waiting for material and changeovers. Performance falls with micro-stops, and with running below rated speed to keep a fragile product or a sticky film under control. Quality falls with rejects: packs that used time and material but can’t be sold. Measuring the Cost of Unplanned Production Downtime puts dollar values on stops.
Worked example: four stages
Worked example. Replace each input with a quote or a measured figure from the plant before using the result.
Rated speeds are in packs per minute (packs per minute equivalent for the case packer). Each stage’s effective rate is rated speed times the three factors, counted in good packs.
Scroll horizontally to see all columns.
| Stage | Rated speed | Availability | Performance | Quality | Effective rate (good packs/min) |
|---|---|---|---|---|---|
| Bagger | 60 | 0.90 | 0.95 | 0.98 | 50.27 |
| Checkweigher | 120 | 0.95 | 0.95 | 0.99 | 107.22 |
| Case packer | 50 | 0.80 | 0.90 | 0.99 | 35.64 |
| Palletizer | 80 | 0.90 | 0.95 | 1.00 | 68.40 |
For the case packer, 50 x 0.80 = 40.00; 40.00 x 0.90 = 36.00; 36.00 x 0.99 = 35.64. For the bagger, 60 x 0.90 = 54.00; 54.00 x 0.95 = 51.30; 51.30 x 0.98 = 50.27 (rounded).
The case packer has the lowest effective rate, so it is the bottleneck. Its rated speed (50) is only a little below the bagger’s (60), but low availability and performance pull it well under the others. Line output is 35.64 good packs per minute.
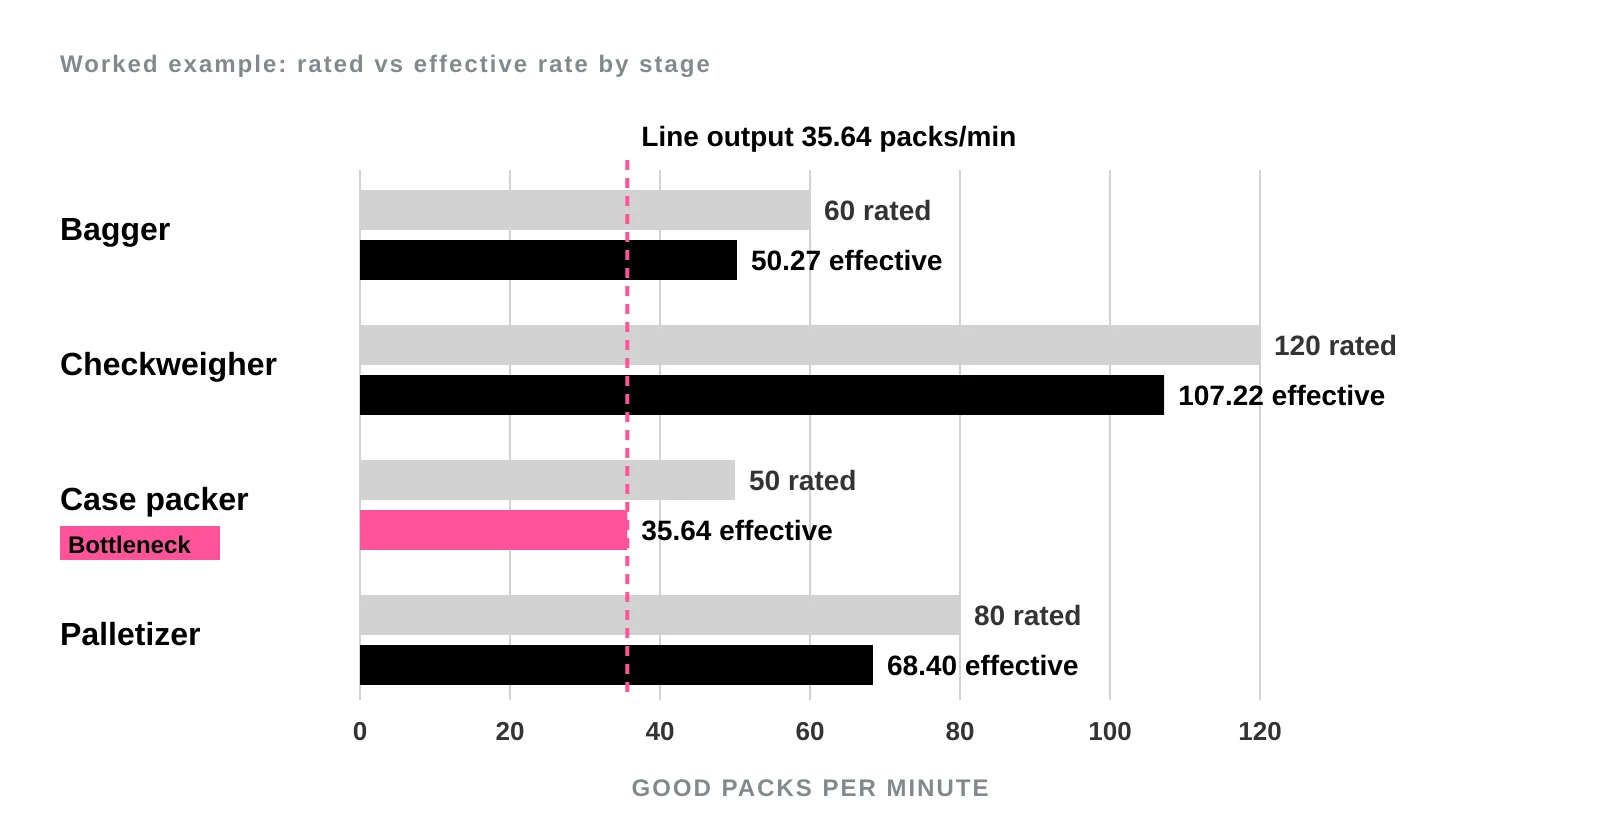
Over an 8-hour planned shift (480 minutes), that is 35.64 x 480 = 17,107 good packs (17,107.2 before rounding).
This is a simplification. It treats each stage as fed whenever it could run, and it ignores how upstream rejects slightly reduce what reaches the stages downstream. For a first look at where the limit sits, it is usually good enough.
Two upgrade options compared
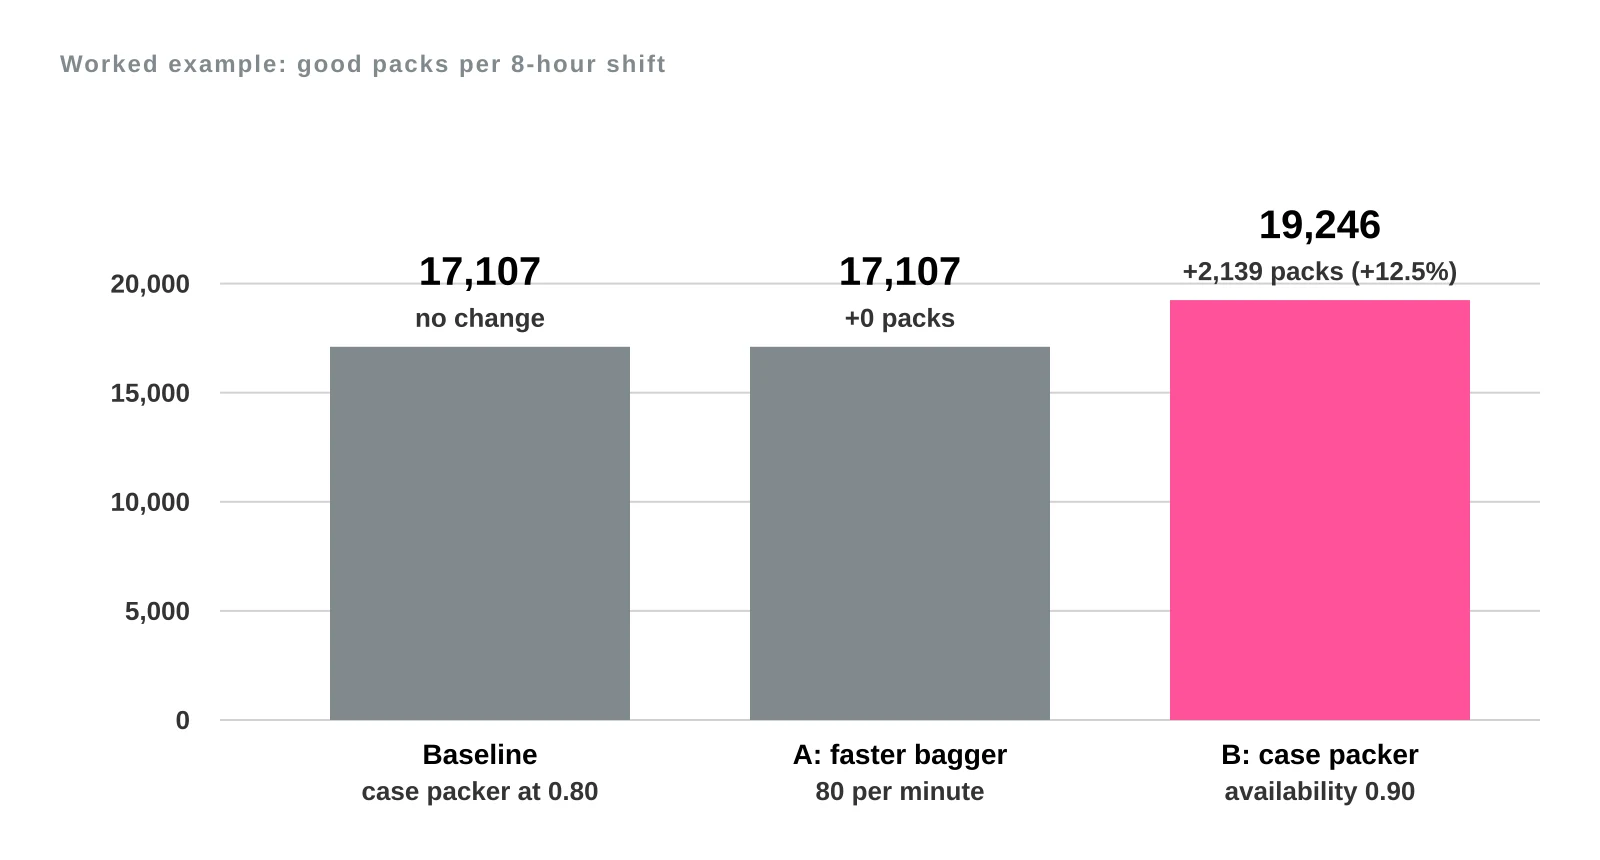
Option A replaces the bagger with a faster model rated at 80 packs per minute, with the same availability, performance and quality. Its effective rate becomes 80 x 0.90 x 0.95 x 0.98 = 67.03 good packs per minute. The case packer still delivers 35.64, so the line does too. Output per shift stays at 17,107 packs, a change of zero.
Option B keeps the bagger and raises the case packer’s availability from 0.80 to 0.90 by fixing its most frequent stops. Its effective rate becomes 50 x 0.90 x 0.90 x 0.99 = 40.095, or 40.10 rounded. The bagger (50.27), checkweigher (107.22) and palletizer (68.40) all stay above it, so the case packer is still the limit and the line delivers 40.095 good packs per minute.
Scroll horizontally to see all columns.
| Scenario | Line output (good packs/min) | Output per 8-hour shift | Change |
|---|---|---|---|
| Baseline | 35.64 | 17,107 | none |
| A: bagger upgraded to 80/min | 35.64 | 17,107 | 0 |
| B: case packer availability 0.90 | 40.10 | 19,246 | +2,139 (+12.5%) |
Option B is 40.095 x 480 = 19,245.6 packs, which rounds to 19,246. The +12.5% gain is the ratio of availability, 0.90 / 0.80 = 1.125. Fixing the constraining stage raised output. The faster machine at a stage that wasn’t the constraint raised nothing.
Buffers do not raise the limit
A buffer, such as an accumulation table or a small conveyor reservoir between two stages, lets the upstream stage keep running during a short stop downstream, and the other way round. That protects the stages from each other and can lift availability a little.
It can’t push average output above the bottleneck’s average rate. If the case packer averages 35.64 good packs a minute, the buffer ahead of it either fills and the bagger waits, or it stays empty and never matters. Buffers smooth out stop-and-go running. They don’t add capacity.
Changeovers and small batches
Every product change takes planned time out of running. A line that changes over four times a day for 30 minutes each loses two hours of an eight-hour shift to changeovers alone. The same line on one long run loses almost none.
Shorter runs lower availability on every stage that needs adjusting, and the bottleneck stage decides how much that costs. It shows up in the cost of each pack, because the same wages and overhead now buy fewer good packs. Cost per Good Pack sets out the arithmetic, and Small Batches and Frequent Changeovers works through how the number and length of changeovers turn into cost per pack.
What to measure before buying
Before approving a faster machine, collect a few weeks of real production data for each stage. A single good day or a vendor demonstration won’t show the pattern.
- Run time per stage, as a share of planned time.
- Stop reasons, with duration, so frequent short stops are visible next to rare long ones.
- Changeover time, from the last good pack of one product to the first good pack of the next.
- Reject rate, and where in the line the rejects occur.
- Waiting time, split into starved (no product arriving) and blocked (nowhere to put product).
Starved and blocked time are the clearest clues. A stage that spends most of its stopped time starved is not the bottleneck. A stage that is rarely starved or blocked and always busy usually is. The same records let you test a supplier’s speed claim against your own product, as described in Comparing Packaging Machinery Quotes on a Like-for-Like Basis.
When a faster machine does help
A faster machine raises line output in three situations.
- It is the bottleneck, and the next-slowest stage has headroom. Output rises until that next stage becomes the limit.
- It also improves availability or quality, for example through quicker changeovers, fewer jams or better rejection of defects, so the gain isn’t only in rated speed.
- Demand will grow and the rest of the line is being upgraded too, so the new machine won’t sit idle.
Whether the extra output is worth the purchase price depends on how many hours the equipment runs on real orders, which How Equipment Utilization Changes Automation Payback covers. More articles on this theme are under Production Economics.
Keep reading
- Cost per Good Pack: A More Useful Measure Than Nameplate Speed: turns line output and changeover losses into a cost you can compare across scenarios.
- How Equipment Utilization Changes Automation Payback: shows how running hours change the payback of the same equipment.
- Automation Payback, ROI and TCO: What Each Metric Tells You: explains which metric answers which investment question.
Assumptions and limits
- Replace the stage figures with the line’s own availability, performance and quality. Those rates differ by product, film, operator and maintenance practice.
- The model takes the minimum of the stage effective rates. It ignores buffer size, upstream rejects reducing downstream flow, and speed that varies by product.
- Availability here covers all lost planned time, including changeovers. Some plants separate planned and unplanned losses, which changes the labels but not the product of the factors.
- Costs, financing, taxes, installation, ramp-up and residual value are left out. The example looks at output only.
- A move from one bottleneck to the next is assumed to be immediate. Real lines need tuning after any change.
- Use this to compare options, not as engineering, safety, financial or legal advice.