 WonksAnonymous
Cost per Good Pack: A More Useful Measure Than Nameplate Speed
How to define cost per good pack, avoid counting scrap twice, and keep equipment investment as a separate, labeled line, with a one-month worked example.
Two machines can carry the same nameplate speed and still cost very different amounts to run. The plant pays for every hour but sells only the packs that pass inspection. So when you compare scenarios, the number to compare is what each sellable pack cost to make.
That number is cost per good pack: cash operating cost for a period divided by good packs produced in that period. Downtime, changeovers and rejects enter through the denominator. Equipment investment gets its own labeled line instead of being mixed into monthly cash cost.
Cost per unit: the basic formula
Production cost per unit is the cost of a period divided by the units produced in that period.
cost per unit = total production cost for the period / units produced in the period
In a spreadsheet, put the period’s cost lines in one column and their total in a cell, put the unit count in the next cell, and divide. With costs in B1 to B5:
Scroll horizontally to see all columns.
| Cell | Entry | Example |
|---|---|---|
| B6 | Total cost: =SUM(B1:B5) | $84,000 |
| B7 | Units produced in the same month | 380,160 |
| B8 | Cost per unit: =B6/B7 | $0.2210 |
| B9 | Cost per 1,000 units: =B8*1000 | $220.96 |
Same month as the worked example below.
This is the average cost per unit, and it is the number most cost-per-unit formulas give you. The catch is the denominator. The 380,160 counts every pack the line made, including the 1% rejected at inspection. Divide the same $84,000 by the 376,358 good packs instead and the cost is $0.2232 per pack, or $223.19 per 1,000, $2.23 more. The plant paid for the rejected packs as well, but it can sell only the good ones, so the good-pack figure is the one to compare. The rest of this article uses it.
The formula
period cash operating cost
  = labor + packaging materials + energy + maintenance
    + other non-duplicated operating spending

cost per good pack
  = period cash operating cost / good packs produced in the same period

cost per 1,000 good packs
  = cost per good pack x 1,000
“Other non-duplicated” means any operating item that isn’t already counted in one of the first four lines, such as consumable supplies or line-specific quality checks. The next section explains why that matters.
Four rules that prevent errors
- Use the same period and the same currency for everything. A month of costs divided by a quarter of output, or euros divided by a dollar-denominated cost, gives a number that means nothing.
- If your packaging-material spending already includes material lost to scrap and setup, don’t add scrap cost again. Material purchases or issues to the line normally include the film or pouches that ended up in rejected packs, so a separate “scrap cost” line counts that material twice.
- Downtime, changeovers and rejects affect cost through fewer good packs. They don’t need a separate “lost output” line on top. Wages and overhead are paid for the hours either way; the good-pack count falls and the division does the rest. Measuring the Cost of Unplanned Production Downtime covers how to value the stop itself.
- Use good packs actually produced, from counters or records, never nameplate speed multiplied by hours. Nameplate times hours is capacity, not output.
Where the good-pack count comes from
For the worked example, the good-pack count follows the logic in Why Faster Machines Do Not Always Increase Line Output. The line’s bottleneck, a case packer, delivers an effective rate of 35.64 good packs per minute (50 rated x 0.80 availability x 0.90 performance x 0.99 quality).
good packs per hour  = 35.64 x 60 = 2,138.4
planned hours/month  = 22 shifts x 8 hours = 176
good packs per month = 2,138.4 x 176 = 376,358 (376,358.4 before rounding)
In practice you would read this number from your own counters. It is derived here so you can see where it comes from.
Worked example: one month, two scenarios
Worked example. Replace each input with a quote or a measured figure from the plant before using the result.
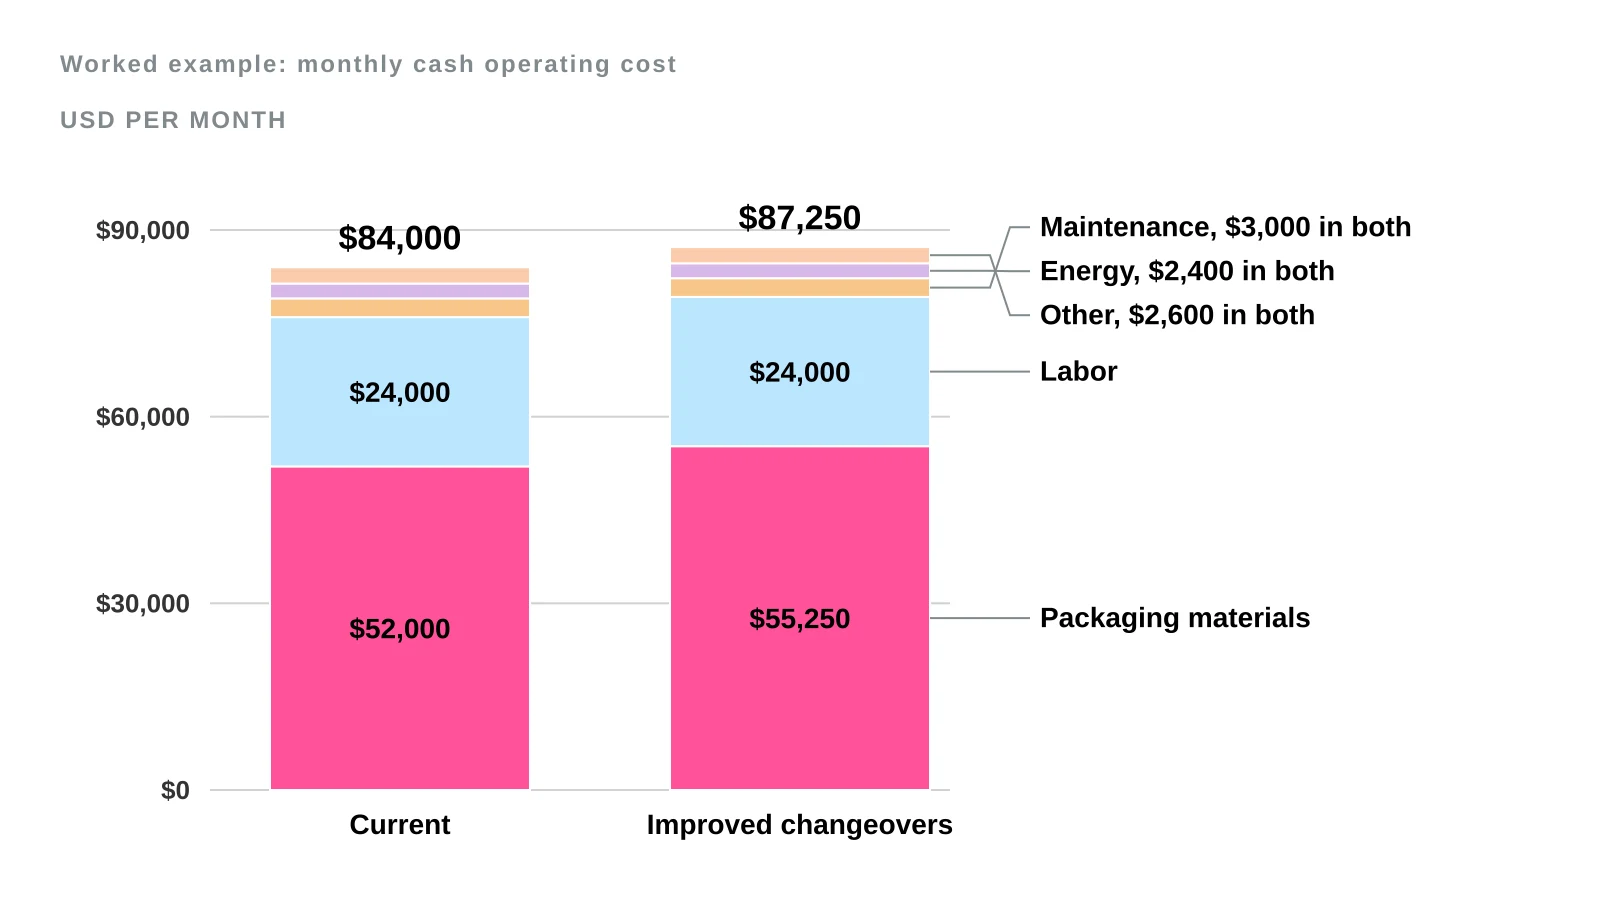
The “improved changeovers” scenario assumes shorter changeovers raise the case packer’s availability from 0.80 to 0.85. Its effective rate becomes 50 x 0.85 x 0.90 x 0.99 = 37.8675 good packs per minute, which is 2,272.05 per hour and 399,881 per month (399,880.8 before rounding), 6.25% more than the current scenario. Small Batches and Frequent Changeovers shows how changeover count and length drive that availability.
Labor, energy, maintenance and other costs stay the same, because the same people work the same hours either way. Packaging materials rise in proportion to output, since each extra pack uses film and cartons: $52,000 x 1.0625 = $55,250. Materials are the largest line here, so a change of format or material moves the result more than most other changes. Rollstock Versus Premade Pouches compares the two options.
Scroll horizontally to see all columns.
| Line | Current | Improved changeovers |
|---|---|---|
| Labor | $24,000 | $24,000 |
| Packaging materials | $52,000 | $55,250 |
| Energy | $2,400 | $2,400 |
| Maintenance | $3,000 | $3,000 |
| Other operating spending | $2,600 | $2,600 |
| Cash operating cost | $84,000 | $87,250 |
| Good packs produced | 376,358 | 399,881 |
| Cost per good pack | $0.2232 | $0.2182 |
| Cost per 1,000 good packs | $223.19 | $218.19 |
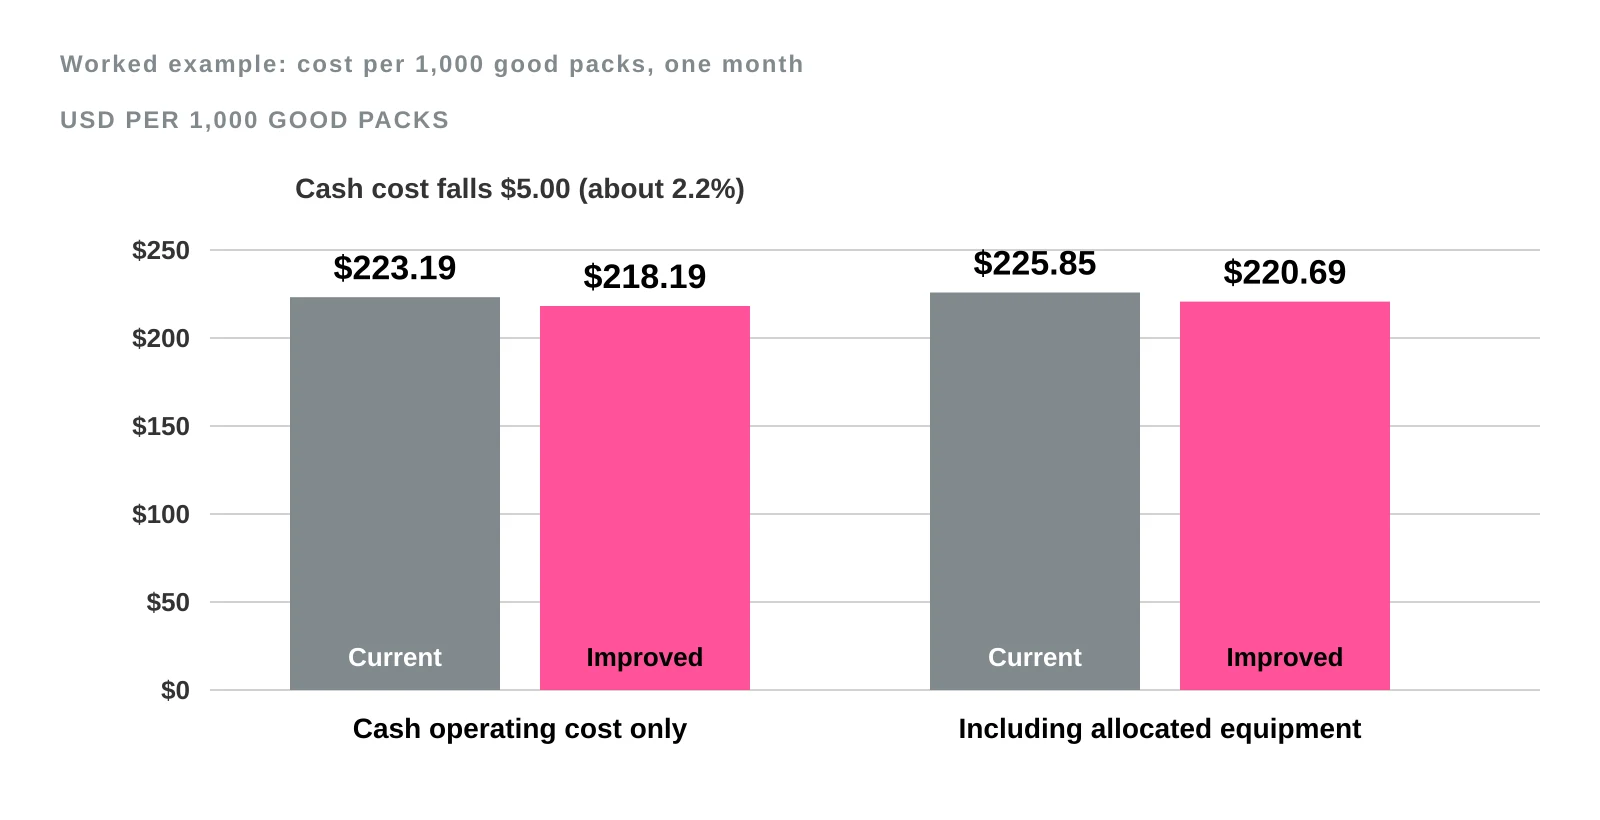
The arithmetic: $84,000 / 376,358 = $0.22319, or $223.19 per 1,000. And $87,250 / 399,881 = $0.21819, or $218.19 per 1,000. Cash cost per 1,000 falls by $5.00, about 2.2%.
Total spending went up by $3,250, yet each good pack cost less. The same fixed hours are spread over more good output. If the extra packs can’t be sold, the improvement isn’t worth having, and this measure can’t tell you whether they can.
Equipment investment is a separate line
Keep equipment cost out of the monthly cash operating figure. A purchase is a one-time outlay, and mixing it into a month distorts both numbers.
When a comparison needs it, add a separate, labeled line with an explicit allocation assumption. For example, an installed cost of $60,000 spread straight-line over 60 months is $1,000 per month. That allocation is for this example. It is not depreciation and it is not an accounting figure.
Scroll horizontally to see all columns.
| Measure | Current | Improved changeovers |
|---|---|---|
| Cash operating cost per good pack | $0.2232 | $0.2182 |
| Allocated equipment cost per month | $1,000 | $1,000 |
| Cost including allocated equipment | $85,000 | $88,250 |
| Including allocated equipment, per good pack | $0.2258 | $0.2207 |
| Including allocated equipment, per 1,000 | $225.85 | $220.69 |
The two figures answer different questions. Cash operating cost per good pack is what the line costs to run. The figure with allocated equipment is what it costs to run and to own, under one stated assumption. Report both and label which is which.
For what belongs in the installed figure, see The True Installed Cost of Packaging Automation. For how running hours affect whether the investment pays back, see How Equipment Utilization Changes Automation Payback.
From OEE to cost per good pack
Overall equipment effectiveness (OEE) is usually defined as availability x performance rate x quality rate. The example above already uses those three factors for the case packer, so its OEE is 0.80 x 0.90 x 0.99 = 71.28%. In the improved changeovers scenario it is 0.85 x 0.90 x 0.99 = 75.7%.
When rated speed and planned hours are fixed, good packs are rated speed x planned minutes x OEE: 50 x 10,560 x 0.7128 = 376,358, the same count as above. So an OEE change reaches cost per good pack through the denominator. How much it moves cost depends on which costs scale with output. Here, labor, energy, maintenance and other spending ($32,000) stay flat, and materials cost $0.1368 for every pack made (52,000 / 380,160).
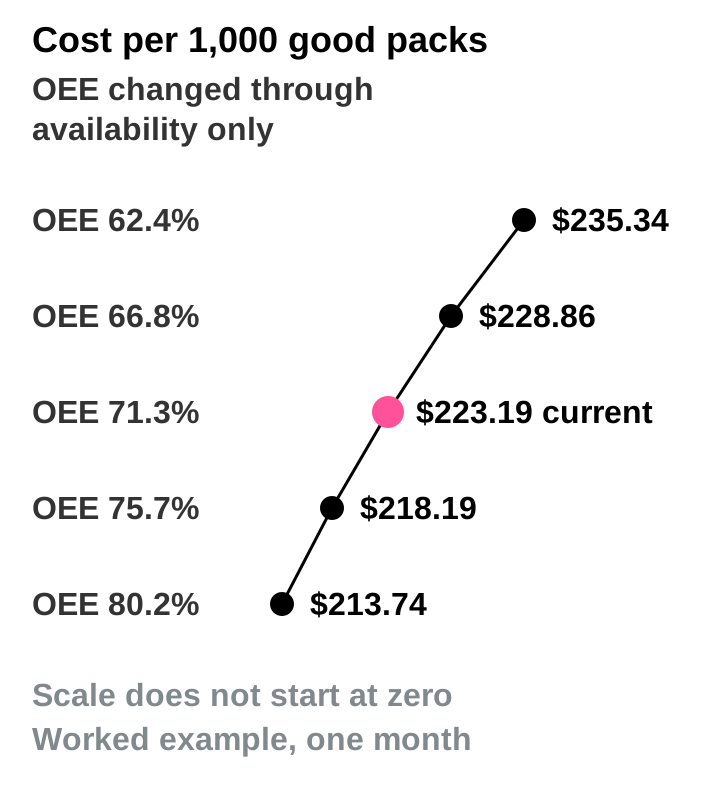
In this sensitivity, OEE changes through availability only; performance stays at 0.90 and quality at 0.99.
Scroll horizontally to see all columns.
| Availability | OEE | Good packs per month | Cash operating cost | Cost per 1,000 good packs |
|---|---|---|---|---|
| 0.70 | 62.4% | 329,314 | $77,500 | $235.34 |
| 0.75 | 66.8% | 352,836 | $80,750 | $228.86 |
| 0.80 (current) | 71.3% | 376,358 | $84,000 | $223.19 |
| 0.85 (improved changeovers) | 75.7% | 399,881 | $87,250 | $218.19 |
| 0.90 | 80.2% | 423,403 | $90,500 | $213.74 |
On these inputs, one OEE point gained through availability, from 71.28% to 72.28%, lowers cost by about $1.18 per 1,000 good packs ($223.19 to $222.02). That figure belongs to this example. A line with a larger flat share of cost gains more per point, and one dominated by materials gains less.
Same OEE, different cost
OEE gives each loss the same weight, while cost per good pack doesn’t. Suppose OEE falls to 69.84% in two ways.
- Through quality: the reject rate rises and quality falls from 0.99 to 0.97. The line still makes 380,160 packs and still buys material for all of them, so cost stays at $84,000, but only 368,755 are good. Cost is $227.79 per 1,000.
- Through availability: availability falls to about 0.784 with quality unchanged. Good packs are again 368,755, but the line makes fewer packs and buys less material, so cost falls to $82,949. Cost is $224.94 per 1,000.
The same OEE costs $2.85 more per 1,000 when the loss is rejects, because each rejected pack has already used film and cartons. That loss is already inside the material line. Adding a separate scrap cost on top would count it twice, as the rules above explain.
OEE and cost per good pack can also disagree for other reasons:
- OEE rises on a machine that is not the bottleneck. The line’s good output doesn’t change, so cost per good pack doesn’t either. The bottleneck article cited in Where the good-pack count comes from shows how to find the constraint.
- An improvement raises OEE but adds cost, such as an extra operator or more expensive material. OEE improves, while cost per good pack can go either way.
- Extra good packs can’t be sold. OEE and cost per good pack both improve on paper, while the cash result doesn’t.
Use OEE to see where time and output are lost, and cost per good pack to decide whether recovering that loss is worth paying for.
What the measure is good for
- Comparing scenarios on one basis: a changeover change, a material change, a different crew size.
- Comparing manual, semi-automatic and automatic setups at your real monthly volume, not the volume on a brochure.
- Spotting where money leaks. If cost per good pack rises while spending is flat, good output has fallen, and stop logs and reject counts will show why.
Where it misleads
- Very low volumes. With few packs, a small change in setup time or one bad batch moves the figure sharply, so a single month may not be representative.
- Mixed product portfolios. A 100 g pouch and a 1 kg bag are not the same unit. Weight packs by a common basis, such as product weight or standard time, or calculate per product family.
- Unusual periods. A month with a long breakdown, a one-off recall, a start-up ramp or a holiday shutdown doesn’t describe normal running. Mark it, or exclude it with a note.
Checklist for collecting inputs
- Pick one period, such as a calendar month, and one currency.
- Take labor from payroll and hours records for the people assigned to the line, including benefits. Automation Payback, ROI and TCO covers how these cost lines feed an investment decision.
- Take packaging materials from purchases or issues to the line, including material that became scrap.
- Take energy, maintenance and other items from invoices or work orders for the same period.
- Take good packs from end-of-line counters or pallet records, not from planned schedules.
- Write down any item you left out and any allocation you assumed.
Keep reading
- Why Faster Machines Do Not Always Increase Line Output: explains how the bottleneck limits the good-pack count behind this measure.
- How Equipment Utilization Changes Automation Payback: shows how running hours change the payback of the same equipment.
- Automation Payback, ROI and TCO: What Each Metric Tells You: sets out which metric answers which investment question.
Assumptions and limits
- The monthly costs are example numbers. Put your own labor, material and energy figures in before trusting the result.
- Costs other than materials are held flat between scenarios. In practice, overtime, extra cleaning or higher wear can move them.
- The equipment allocation is a straight-line assumption for comparison, not a depreciation schedule. Financing, taxes, residual value and the time value of money are left out.
- The good-pack count assumes the case packer is the only constraint and that every pack produced can be sold.
- Product mix, seasonality and ramp-up are ignored.
- The OEE table changes availability only and holds labor, energy, maintenance and other costs flat across availability levels. Materials scale with packs made.
- Treat this as a way to compare scenarios, not as financial, legal, safety or engineering advice.
Sources
- Douglas S. Thomas, National Institute of Standards and Technology, NIST AMS 100-18: The Costs and Benefits of Advanced Maintenance in Manufacturing (definition of OEE as availability x performance rate x quality rate, citing ISO 22400-2:2014)