 WonksAnonymous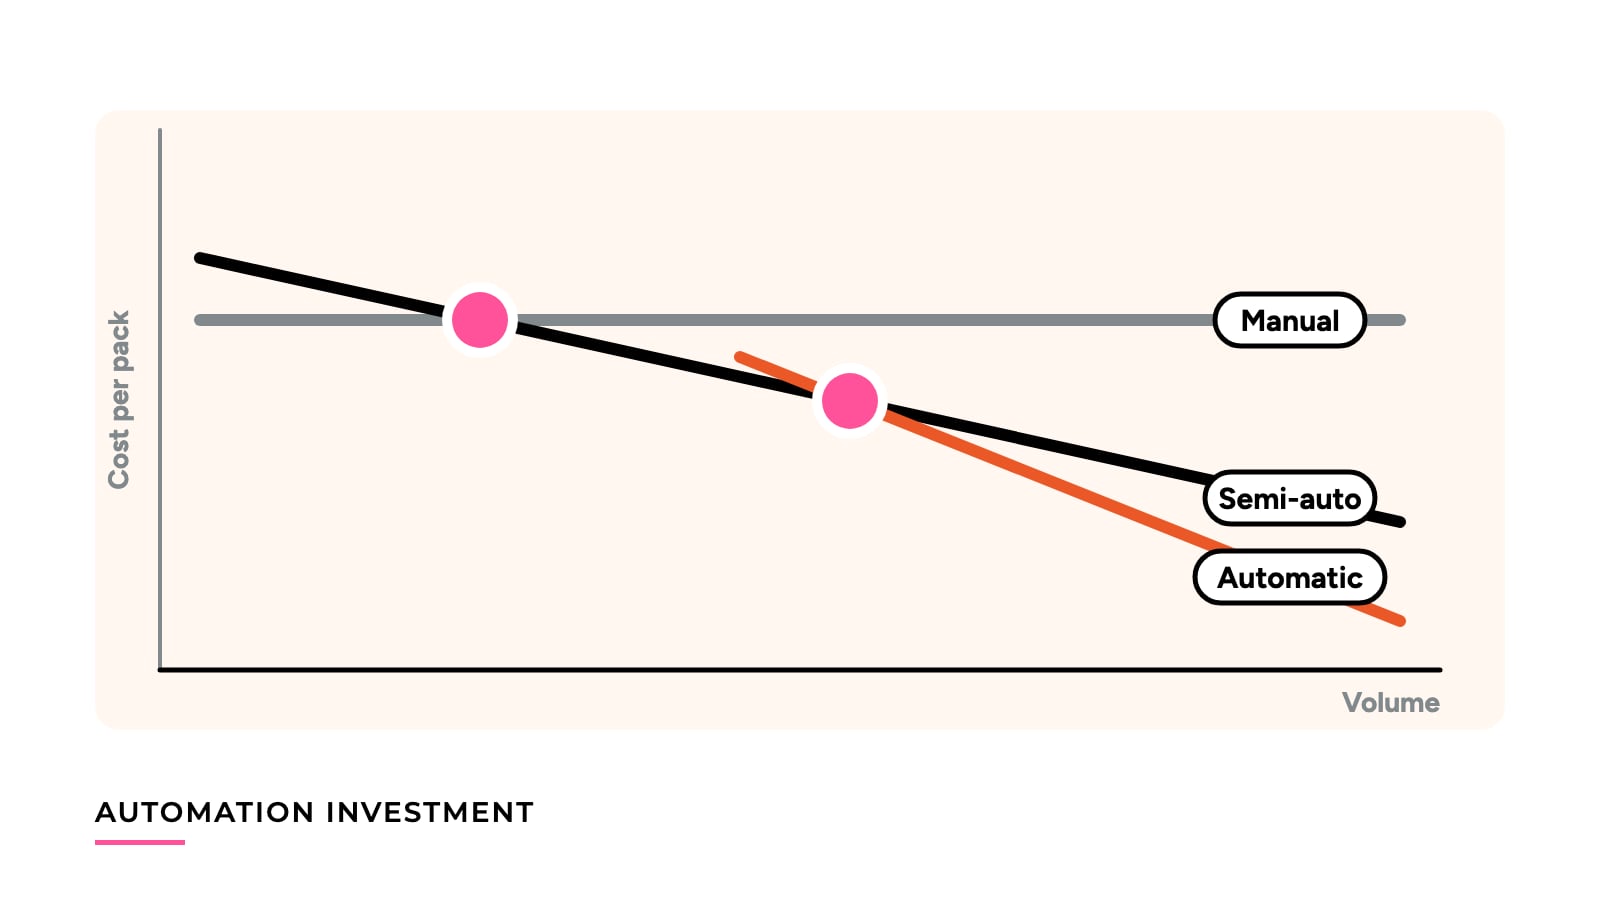
Manual, Semi-Automatic or Fully Automatic Packaging? A Cost Model
A volume-based cost model that puts manual, semi-automatic and fully automatic packaging on one basis, with the crossover volumes worked out and checked.
Should you pack by hand, buy a semi-automatic machine, or go to a fully automatic line? It comes down to how many good packs you make in a year. Each step up the ladder trades more fixed cost for less cost on every pack.
Below a certain volume the option that is cheaper to own wins, and above it the option that is cheaper to run wins. In the example below, manual is cheapest up to 200,000 packs a year, semi-automatic from there to 1,000,000, and fully automatic above that. Change the inputs and those numbers move, sometimes a lot.
The cost model
Put all three options on the same basis: one year of cost, divided by good packs.
Annual cost = annualized equipment cost
            + fixed annual costs
            + (variable cost per good pack x annual good packs)

Annualized equipment cost = installed cost / stated life in years
Cost per good pack = annual cost / annual good packs
Annualized equipment cost is a straight-line split of the installed cost over a stated life, a planning assumption and not an accounting or tax figure. Installed cost means everything needed to get the machine producing, as described in the true installed cost of packaging automation.
Fixed annual costs don’t change with volume, a maintenance contract for example. Variable cost per pack covers direct labor, material waste and energy for each good pack. Only good packs count, because rejects still use up labor and material, as cost per good pack explains.
Example inputs
Worked example. Replace each input with a quote or a measured figure from the plant before using the result.
Scroll horizontally to see all columns.
| Input | Manual | Semi-automatic | Fully automatic |
|---|---|---|---|
| Installed cost | $7,500 (bench and tooling) | $30,000 | $126,000 |
| Stated life | 5 years | 5 years | 7 years |
| Annualized equipment cost | $1,500 | $6,000 | $18,000 |
| Maintenance and other fixed | $0 | $1,500 | $19,500 |
| Fixed annual total | $1,500 | $7,500 | $37,500 |
| Labor per good pack | $0.10 | $0.06 | $0.02 |
| Material waste and energy per good pack | $0.02 | $0.03 | $0.04 |
| Variable cost per good pack | $0.12 | $0.09 | $0.06 |
| Realistic output, one shift | 250,000 packs/year | 800,000 packs/year | 3,000,000 packs/year |
Arithmetic: 7,500 / 5 = 1,500; 30,000 / 5 = 6,000; 126,000 / 7 = 18,000. Fixed totals: 1,500 + 0 = 1,500; 6,000 + 1,500 = 7,500; 18,000 + 19,500 = 37,500. Variable: 0.10 + 0.02 = 0.12; 0.06 + 0.03 = 0.09; 0.02 + 0.04 = 0.06.
Automation cuts labor per pack, but the machine uses more energy and setup can waste more material, so the material and energy line goes up. The output row is an assumption about one shift, not a machine rating.
Annual cost at four volumes
Scroll horizontally to see all columns.
| Annual good packs | Manual | Semi-automatic | Fully automatic |
|---|---|---|---|
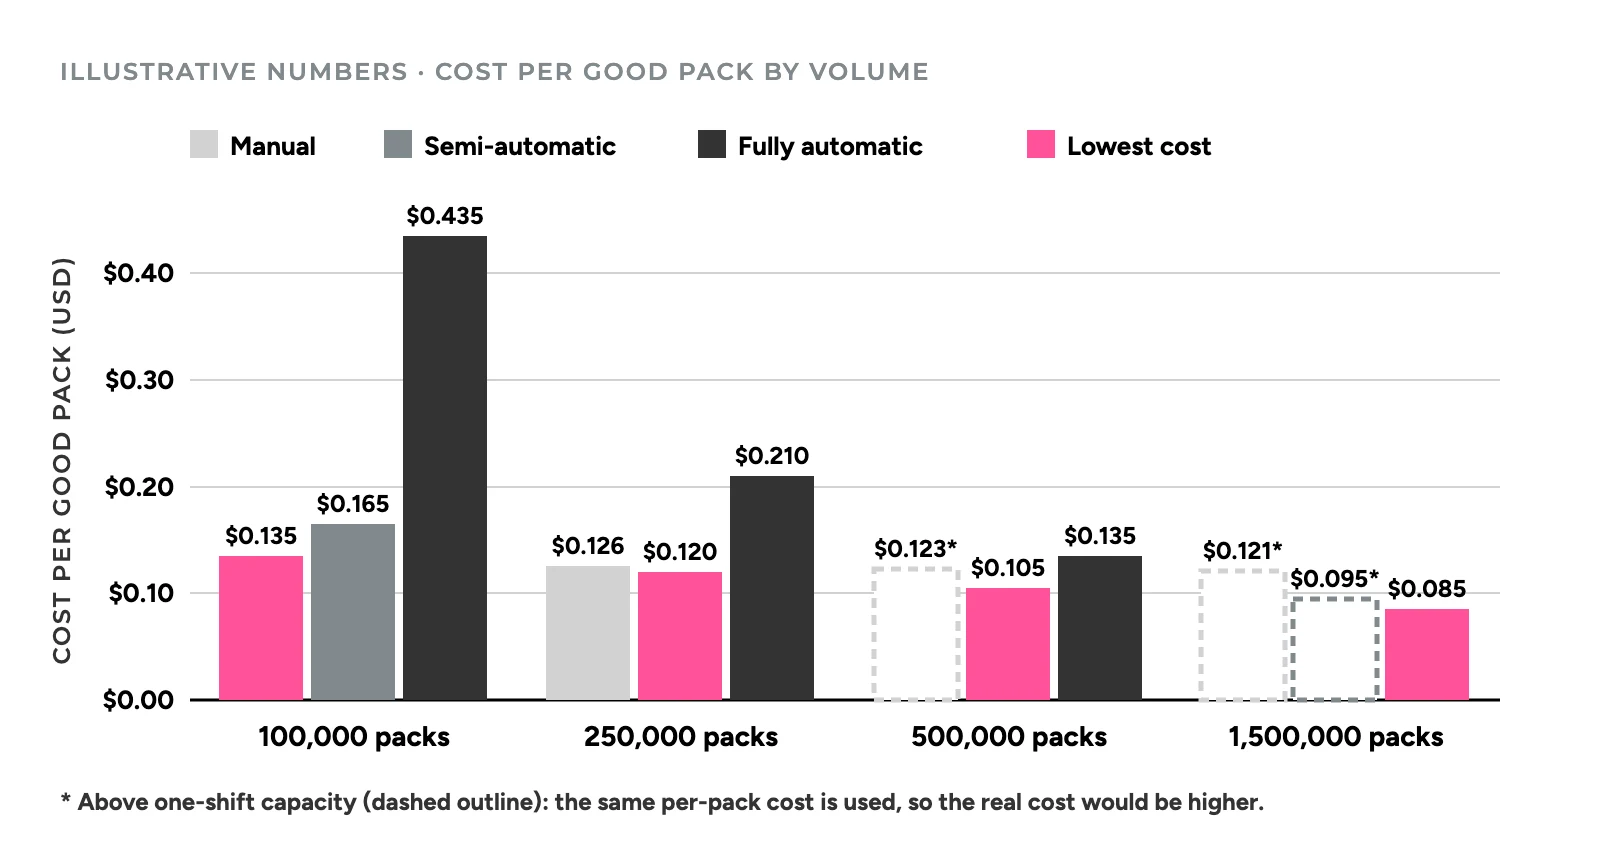
| 100,000 | $13,500 ($0.135/pack) | $16,500 ($0.165) | $43,500 ($0.435) |
| 250,000 | $31,500 ($0.126) | $30,000 ($0.120) | $52,500 ($0.210) |
| 500,000 | $61,500 ($0.123)* | $52,500 ($0.105) | $67,500 ($0.135) |
| 1,500,000 | $181,500 ($0.121)* | $142,500 ($0.095)* | $127,500 ($0.085) |
*Above one-shift capacity. The figure uses the same per-pack cost, so it understates what that volume would cost.
Worked checks: at 100,000 packs, manual = 1,500 + 0.12 x 100,000 = 1,500 + 12,000 = $13,500, and 13,500 / 100,000 = $0.135. At 500,000 packs, semi-automatic = 7,500 + 0.09 x 500,000 = 7,500 + 45,000 = $52,500, and 52,500 / 500,000 = $0.105. At 1,500,000 packs, fully automatic = 37,500 + 0.06 x 1,500,000 = 37,500 + 90,000 = $127,500, and 127,500 / 1,500,000 = $0.085.
The lowest cost in each row is manual at 100,000, semi-automatic at 250,000 and 500,000, and fully automatic at 1,500,000.
The two crossover volumes
At the crossover volume two options cost the same. To find it, set the two annual cost formulas equal and solve for volume.
Crossover volume = (difference in fixed annual costs)
                 / (difference in variable cost per pack)
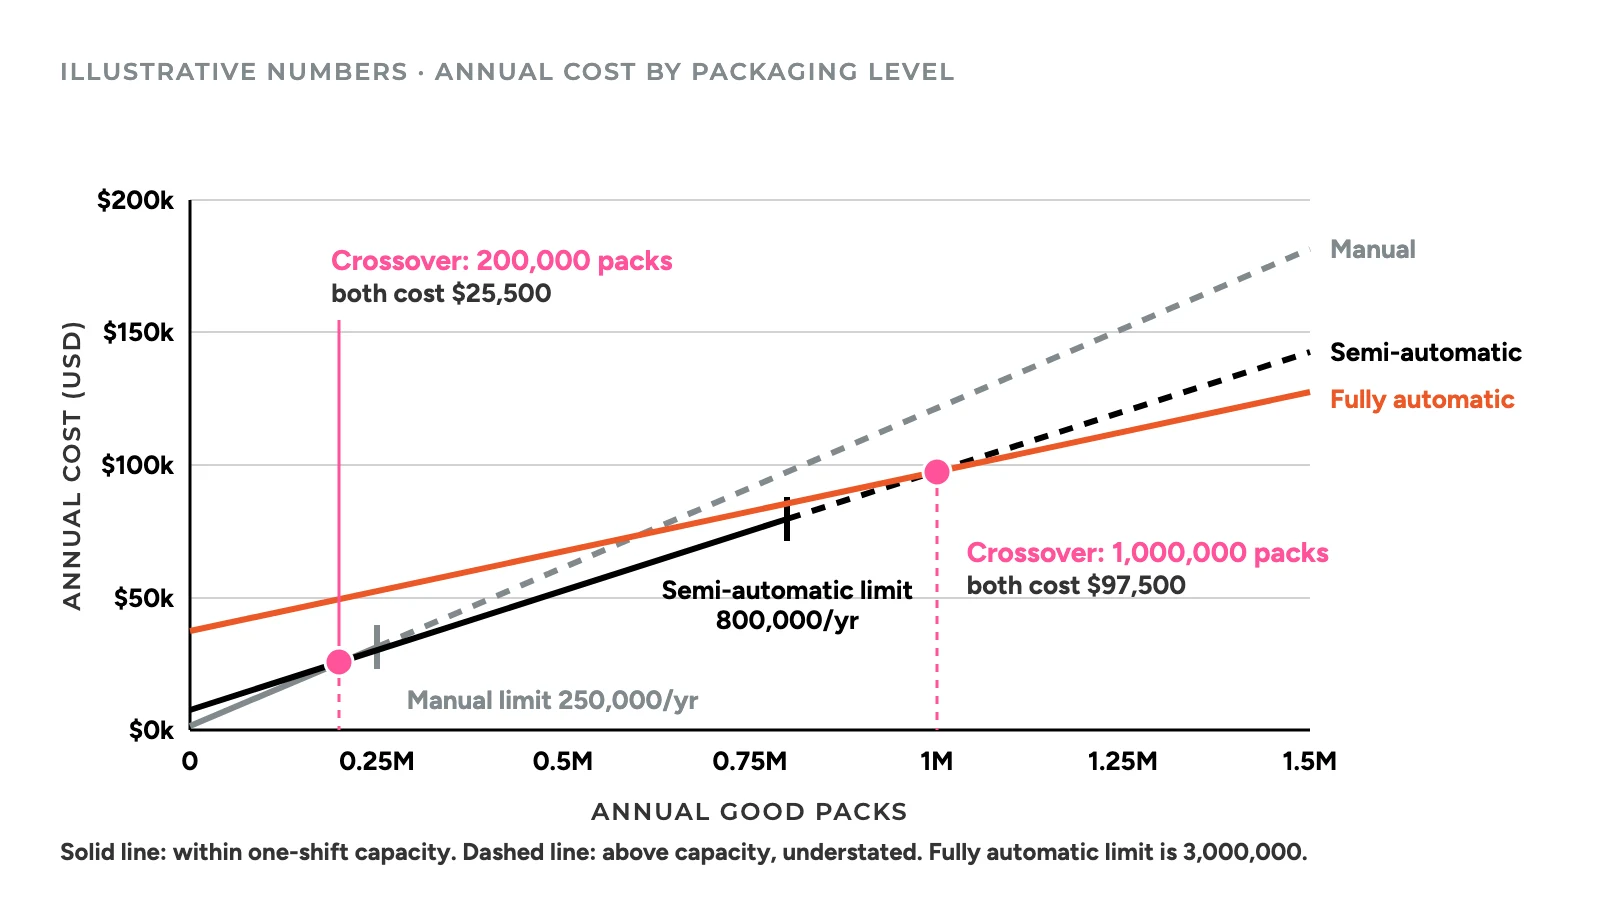
Manual to semi-automatic: (7,500 - 1,500) / (0.12 - 0.09) = 6,000 / 0.03 = 200,000 packs per year. Check: manual at 200,000 = 1,500 + 24,000 = $25,500; semi-automatic = 7,500 + 18,000 = $25,500.
Semi-automatic to fully automatic: (37,500 - 7,500) / (0.09 - 0.06) = 30,000 / 0.03 = 1,000,000 packs per year. Check: semi-automatic at 1,000,000 = 7,500 + 90,000 = $97,500; fully automatic = 37,500 + 60,000 = $97,500.
Capacity changes the answer
The cost formula assumes you can reach the volume at the stated variable cost, and one shift can’t always do that.
Manual packing tops out at 250,000 packs a year in this example. Above that you add people or shifts, and the per-pack cost no longer holds. The 200,000 crossover sits below the limit, so it stands. The 500,000 and 1,500,000 manual figures in the table are marked for that reason.
The semi-automatic limit matters more. The 1,000,000 crossover sits above its 800,000 one-shift capacity, so past 800,000 you need a second unit or a second shift. A second identical unit adds $7,500 of fixed cost, so at 1,500,000 packs the semi-automatic route costs 15,000 + 0.09 x 1,500,000 = 15,000 + 135,000 = $150,000. That is $22,500 more than the fully automatic $127,500. In practice automation wins as soon as demand outgrows one semi-automatic unit, well before 1,000,000. Confirm first that the rating is real output; see why faster machines do not always increase line output.
What moves the crossovers
Wages move both crossovers, because labor is the part of variable cost that automation removes. To see how much, split the variable costs above into labor and everything else, then change labor by 20% in each direction:
Scroll horizontally to see all columns.
| Labor cost | Manual / semi / auto variable | Manual-to-semi crossover | Semi-to-auto crossover |
|---|---|---|---|
| 20% lower | $0.100 / $0.078 / $0.056 | 6,000 / 0.022 = about 272,700 | 30,000 / 0.022 = about 1,363,600 |
| Base case | $0.120 / $0.090 / $0.060 | 200,000 | 1,000,000 |
| 20% higher | $0.140 / $0.102 / $0.064 | 6,000 / 0.038 = about 157,900 | 30,000 / 0.038 = about 789,500 |
Higher wages pull both crossovers toward lower volume, so automation pays off sooner. Cheaper labor pushes them out. A plant with low wages can reasonably stay manual at volumes where a high-wage plant shouldn’t.
Shifts matter too. A second shift on a manual line adds labor hours but no fixed equipment cost, though it changes hiring and supervision. A machine running two shifts spreads its annualized cost over more packs, which is the utilization effect covered in how equipment utilization changes automation payback.
Product mix is the next lever. Every changeover is time when no good packs are made, so frequent format changes raise the effective variable cost of the faster, harder-to-adjust options. Small batches and frequent changeovers shows how to cost that. Higher scrap on any option likewise raises its variable cost per good pack.
Finally, the labor reduction in the model is a cash saving only if wages actually stop. If the people move to other work, you’ve saved hours, not cash. Labor savings versus redeployment separates the two.
Factors the model does not price
These belong in the decision too. Price them from the plant’s own records rather than from the cost table above.
- Consistency: machines usually vary less from pack to pack than hand work, which can cut rejects and complaints.
- Ergonomics and safety: repetitive manual tasks carry strain risks, while machines add guarding and lockout needs.
- Hiring: if you can’t fill manual roles, the wage in the model isn’t the real constraint.
- Floor space: a fully automatic line needs room for the machine, feed and discharge.
- New formats: manual packing adapts to a new pack in a day. Machines may need new tooling or a new machine, and the choice of film or premade pouch changes both the machine and the variable cost (see rollstock versus premade pouches).
- Demand certainty: a crossover at 1,000,000 packs is a poor target if your forecast is 300,000 with wide error bars.
Run this on your own numbers
- List the realistic annual good packs for the next three to five years, as a range rather than a single figure.
- Get installed cost for each option, not equipment price alone, and choose a stated life.
- Write down fixed annual costs: service contracts, spares, software, and insurance if it doesn’t vary with volume.
- Measure variable cost per good pack: loaded labor per pack, material waste and energy, counting good packs only.
- Check the one-shift capacity of each option against your volume range, and mark any option that needs added shifts or units.
- Compute annual cost and cost per good pack at the low, middle and high ends of the range.
- Compute both crossovers, then repeat with wages, scrap and utilization 20% worse and 20% better.
- Compare the result with your volume range. If the range straddles a crossover, the non-cost factors decide.
When the conclusion changes
If your forecast sits below the first crossover, the model says stay manual for now. At 100,000 packs a year, a semi-automatic line adds $3,000 of annual cost in this example and a fully automatic one adds $30,000. At that volume, a co-packer is a fourth option worth pricing; see contract packing versus owning a packaging line.
If it sits between the crossovers, semi-automatic is enough, and the fully automatic line needs volume to grow before it earns its fixed cost. Fully automatic wins only when volume is high, labor is expensive, or the simpler options have run out of one-shift capacity.
Read the result as a ranking under stated assumptions. For the wider return question, see automation payback, ROI and TCO, and the automation investment hub for related analysis.
Keep reading
- The True Installed Cost of Packaging Automation: read it before you put an installed cost into the model.
- Small Batches and Frequent Changeovers: The Hidden Cost of Packaging: if your product mix changes often, this shows how that raises variable cost on the faster options.
- Labor Savings Versus Redeployment: Avoiding False Payback Claims: useful when the case for a machine rests on labor savings.
Assumptions and limits
- Replace every input with quotes, wage records and measured per-pack costs.
- Straight-line allocation is a comparison device, not depreciation. Residual value is ignored.
- The model ignores taxes, financing, the time value of money, ramp-up and learning curves, and it holds costs constant across years.
- Per-pack costs stay flat across volume except where the capacity section says otherwise. Real costs step up when you add shifts, people or units.
- Downtime, product mix and changeovers are not modeled beyond the notes above. The editorial policy explains how the site separates sourced facts from scenario assumptions.
- Use the model to compare options, and get financial, safety and engineering review before you commit money.