 WonksAnonymous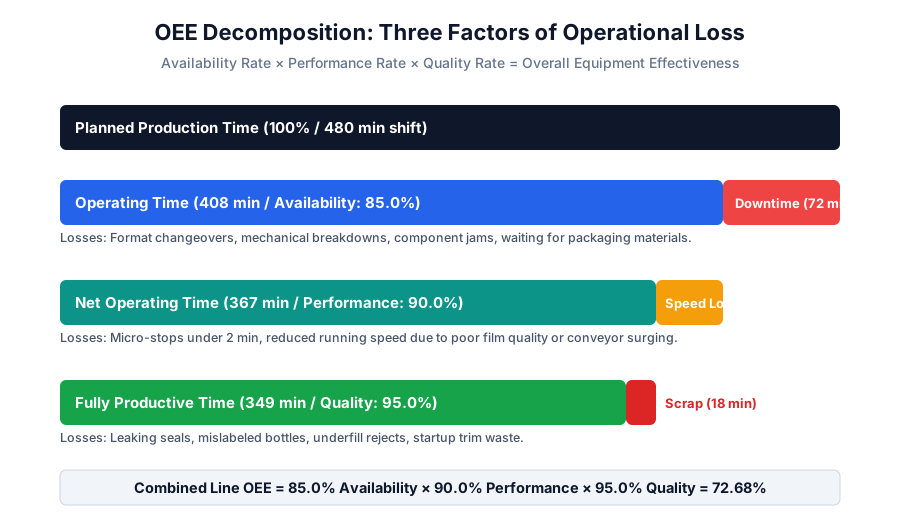
Calculating OEE on Packaging Lines: Availability, Performance, and Quality
A practical guide to calculating Overall Equipment Effectiveness (OEE) on packaging lines, diagnosing the six big losses, and avoiding bottleneck averaging errors.
When a packaging line struggles to meet shipment schedules, plant managers often default to requesting faster machinery. Yet in most packaging halls, machinery is already capable of running substantially faster than current output indicates.
The difference between what a line produces and what it could produce is captured by Overall Equipment Effectiveness (OEE).
OEE is not an abstract corporate benchmarking score. When calculated properly at the line constraint, it isolates whether lost packaging capacity stems from availability losses (unplanned stops and changeovers), performance losses (slow running and micro-stoppages), or quality losses (scrap and rework).
The Three Fundamental Factors of OEE
OEE multiplies three percentages derived from planned production time:
$$\text{OEE} = \text{Availability} \times \text{Performance} \times \text{Quality}$$
1. Availability Rate: Scheduled Time vs. Operating Time
Availability measures the proportion of planned production time the line actually runs. It reflects stop-time losses:
$$\text{Availability} = \frac{\text{Actual Operating Time}}{\text{Planned Production Time}}$$
- Planned Production Time: Total shift duration minus planned non-production stops (such as statutory lunch breaks or planned plant-wide maintenance shutdowns).
- Unplanned Downtime: Mechanical breakdowns, sensor faults, conveyor motor trips, upstream starvation, or downstream blockage.
- Changeover Time: Tooling swaps, sanitization cleanouts (CIP), and guide rail adjustments when switching container formats.
To price downtime events accurately, refer to measuring the cost of unplanned production downtime.
2. Performance Rate: Rated Speed vs. Net Speed
Performance measures how quickly the line runs while operating, compared to its maximum engineered speed (Ideal Cycle Time or Nameplate Speed):
$$\text{Performance} = \frac{\text{Total Units Produced} \times \text{Ideal Cycle Time}}{\text{Actual Operating Time}}$$
Performance losses represent capacity eroded without triggering a formal maintenance downtime log:
- Micro-Stops and Idling: Brief stoppages lasting 10 to 60 seconds (such as a fallen bottle uprighted by an operator, a momentary pouch photo-eye misread, or an accumulation surge).
- Reduced Operating Speed: Running a cartoner at 65 packs per minute instead of its rated 80 packs per minute because corrugated blanks jam at higher speeds or seal bars overheat.
3. Quality Rate: Good Units vs. Total Units
Quality measures the percentage of manufactured packages that satisfy customer specifications on the first pass:
$$\text{Quality} = \frac{\text{Good Units Sold / Shipped}}{\text{Total Units Produced}}$$
Quality losses include startup scrap produced while tuning pouch seal temperatures, leaky containers rejected by seal integrity testers, underfill rejects caught by checkweighers, and damaged cases dropped during palletizing.
To model how scrap impacts per-unit financial costs, review cost per good pack.
Worked Example: A Multi-Stage Packaging Line Shift
Consider an 8-hour packaging shift (480 minutes) running a vertical form-fill-seal (VFFS) bagging line:
| Metric | Measured Value | Calculation / Formula |
|---|---|---|
| Shift Duration | 480 minutes | Total scheduled shift |
| Planned Breaks | 30 minutes | Planned non-operating time |
| Planned Production Time | 450 minutes | 480 min − 30 min |
| Unplanned Downtime | 45 minutes | Film roll change & jam clearance |
| Operating Time | 405 minutes | 450 min − 45 min |
| Availability Rate | 90.0% | 405 min / 450 min |
| Ideal Nameplate Speed | 60 packs / min | 1.000 sec per pack |
| Total Units Run | 21,870 packs | Output counter during operating time |
| Theoretical Output at Ideal Speed | 24,300 packs | 405 min × 60 packs/min |
| Performance Rate | 90.0% | 21,870 packs / 24,300 packs |
| Defective / Rejected Packs | 875 packs | Leaker check & checkweigher rejects |
| Good Output Packs | 20,995 packs | 21,870 packs − 875 packs |
| Quality Rate | 96.0% | 20,995 good / 21,870 total |
| Final Line OEE | 77.76% | 0.90 × 0.90 × 0.96 = 77.76% |
While individual scores appear respectable (90%, 90%, 96%), the combined compound effect leaves more than 22% of line capacity unharvested.
The Bottleneck Rule: Never Average OEE Across Machines
The most common operational mistake in multi-machine lines is calculating an “average OEE” by taking the arithmetic mean of each station (filler, capper, labeler, case packer).
A packaging line is a rigid serial chain:
- The Bottleneck Dictates Line OEE: Line OEE must be measured at the primary pacemaker machine (the constraint). If your case packer limits line throughput to 36 cases per minute, running the upstream filler at 98% OEE merely piles excess work-in-progress onto accumulation tables.
- Starvation and Blockage: Non-bottleneck machines will naturally exhibit low availability because they are either starved for input from upstream or blocked by backed-up downstream accumulation. Treating non-bottleneck downtime as machine failure results in misallocated capital expenditure.
Before committing capital to speed upgrades, review why faster machines do not always increase line output.