 WonksAnonymous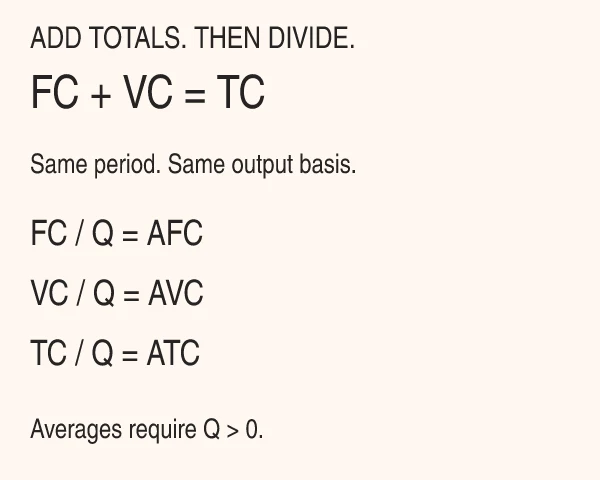
Fixed, Variable and Total Cost: Formulas That Reconcile
Calculate FC, VC, TC, AFC and AVC with a worked production-line example, separate total and unit-cost charts, and copyable Excel formulas.
Mixing a monthly expense with a cost per unit can make a production budget look cheaper than it is. Add fixed and variable costs for the same period to find total cost, then divide by that period’s output to calculate the corresponding averages.
Use this quick reference before entering numbers. Here, Q means output units in one period, and v is a constant variable cost per unit only where that assumption is justified.
| Measure | Formula | Unit |
|---|---|---|
| Total cost, TC | FC + VC | Dollars per period |
| Fixed cost, FC | TC − VC | Dollars per period |
| Total variable cost, VC | TC − FC; or v × Q in the linear model | Dollars per period |
| Average fixed cost, AFC | FC ÷ Q | Dollars per unit |
| Average variable cost, AVC | VC ÷ Q | Dollars per unit |
| Average total cost, ATC | TC ÷ Q = AFC + AVC | Dollars per unit |
All averages require Q greater than zero. The dollar amounts below are an original teaching example, not factory observations, supplier prices or industry benchmarks.
Establish one period, one output definition and one cost scope
Write the period above the calculation: in our example, one month. State whether output means items started, completed or accepted. This example assumes one product, all completed items accepted, and no inventory change. It deliberately leaves reject and rework accounting to cost per good pack.
Next list the expenses included. Our hypothetical line has $2,400 of fixed monthly operating costs and $0.60 of variable operating cost per completed unit. The model applies from zero to 6,000 units per month, with unchanged facilities, contracts and unit input requirements. Equipment purchase expenditure, financing, tax and opportunity costs are outside this example.
The OpenStax short-run cost chapter supplies the standard definitions: total cost combines fixed and variable costs; an average divides the relevant total by output. The numerical example and spreadsheet here are our own.
For a production budget, put the scope beside the result. “$1.20 per unit” without its period, output and included expenses is not enough to compare two lines. The production economics reading guide connects this calculation to operating decisions.
Takeaway: Every number must share the same period, output definition and expense boundary.
Calculate total costs before calculating costs per unit
For the illustrative month at 4,000 units:
- Variable cost: $0.60 per unit × 4,000 units = $2,400.
- Fixed cost: $2,400, unchanged within the stated range.
- Total cost: $2,400 + $2,400 = $4,800.
You can reverse the arithmetic when two totals are known. If TC is $4,800 and VC is $2,400, FC = $4,800 − $2,400 = $2,400. That subtraction does not independently establish which expenses behave as fixed; it only reconciles the amounts already classified.
| Illustrative monthly output | FC | VC at $0.60/unit | TC |
|---|---|---|---|
| 0 units | $2,400 | $0 | $2,400 |
| 2,000 units | $2,400 | $1,200 | $3,600 |
| 4,000 units | $2,400 | $2,400 | $4,800 |
| 6,000 units | $2,400 | $3,600 | $6,000 |
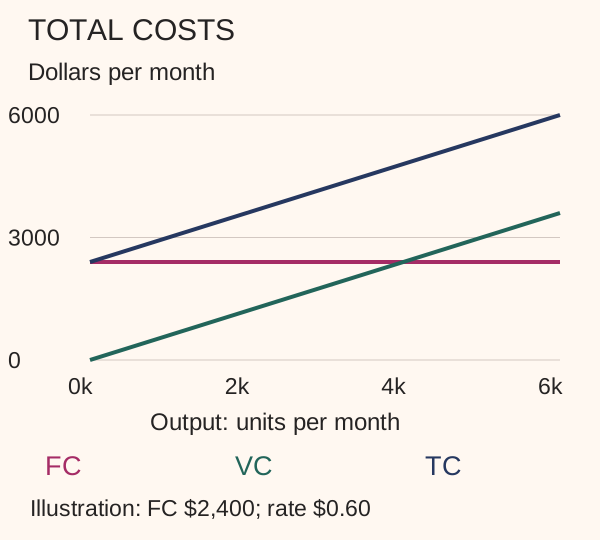
The line can spend more in total while spending less per unit. Do not use a falling unit cost as evidence that the month’s payment requirement falls. Nor does the arithmetic prove that the line can produce the higher volume: check line throughput and the bottleneck separately.
Common mistake: Adding $2,400 per month to $0.60 per unit. Multiply the unit rate by monthly output first; only then can the totals be added.
Takeaway: Build FC, VC and TC in dollars per period before drawing conclusions from an average.
Explain why AFC falls while total spending rises
At 4,000 units, AFC = $2,400 ÷ 4,000 = $0.60 per unit. AVC = $2,400 ÷ 4,000 = $0.60 per unit. ATC = $4,800 ÷ 4,000 = $1.20 per unit. Adding AFC and AVC gives the same answer as dividing TC directly.
| Illustrative monthly output | AFC | AVC | ATC |
|---|---|---|---|
| 0 units | Undefined | Undefined | Undefined |
| 2,000 units | $1.20/unit | $0.60/unit | $1.80/unit |
| 4,000 units | $0.60/unit | $0.60/unit | $1.20/unit |
| 6,000 units | $0.40/unit | $0.60/unit | $1.00/unit |
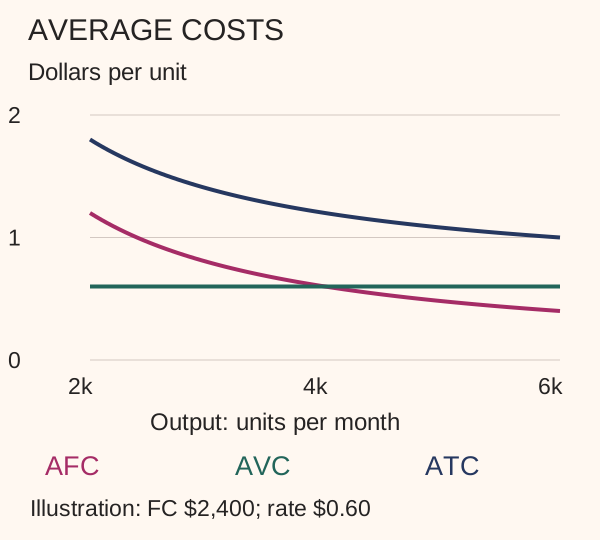
Increasing illustrative output from 2,000 to 4,000 spreads the same fixed total across twice as many units. It does not remove any of the $2,400 fixed expense. TC rises by $1,200, even as ATC falls by $0.60 per unit.
This distinction matters when someone proposes producing extra inventory merely to report a lower average. Our formula has no selling price, customer demand or inventory holding cost. It cannot tell you whether the additional output should be made. Batch size and changeover cost addresses a related scheduling decision; equipment utilization and payback connects realistic running volume to an investment case.
Takeaway: Lower AFC is an allocation effect; it is not a reduction in the fixed bill.
Build an Excel sheet that keeps assumptions visible
Enter the three inputs below. Keep currency symbols in cell formatting, not in the numeric value. The example uses English Excel syntax; installations using different regional separators may require semicolons instead of commas.
| Cell | Label | Entry |
|---|---|---|
| B2 | Output, units/month | 4000 |
| B3 | Fixed cost, dollars/month | 2400 |
| B4 | Variable rate, dollars/unit | 0.60 |
| B6 | VC, dollars/month | =B2*B4 |
| B7 | TC, dollars/month | =B3+B6 |
| B9 | AFC, dollars/unit | =IF(B2>0,B3/B2,NA()) |
| B10 | AVC, dollars/unit | =IF(B2>0,B6/B2,NA()) |
| B11 | ATC, dollars/unit | =IF(B2>0,B7/B2,NA()) |
| B13 | Total reconciliation | =B7-B3-B6 |
| B14 | Average reconciliation | =IF(B2>0,B11-B9-B10,NA()) |
B13 should be zero. B14 should be zero apart from possible spreadsheet floating-point rounding. Displaying two decimal places changes the presentation, not the stored value; retain full precision for further calculations.
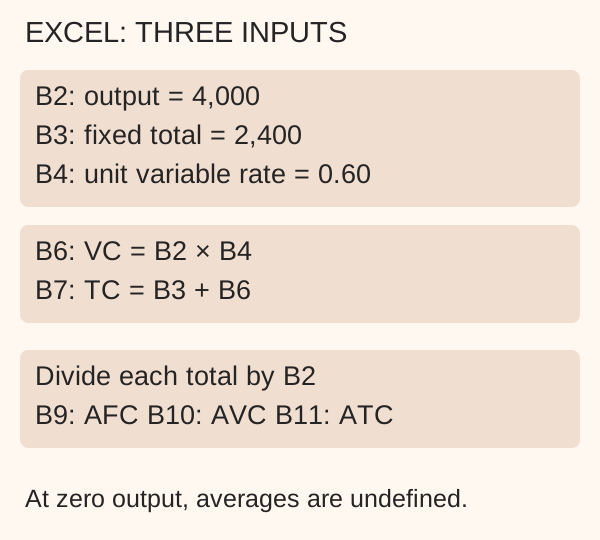
Set B2 to zero as a deliberate edge-case check. VC becomes zero and TC stays $2,400; the three average cells show #N/A, meaning the average is unavailable. They must not silently become zero. This formula also flags negative output as unavailable; it does not replace validation of missing inputs, text or unreasonable values.
For a scenario table, put quantities in A18 onward and use =$B$3 for FC and =A18*$B$4 for VC. The dollar signs keep assumptions fixed when formulas are copied down. Review the copied formulas before using a sheet for purchasing or budgeting.
Common mistake: Applying a blanket error handler that turns every error into zero. A missing input, bad reference and genuinely zero expense are different conditions.
Takeaway: Keep inputs visible, reconcile totals, and leave zero-output averages explicitly undefined.
Check cost behavior before extending the line
A straight VC line assumes a constant variable rate. It is a useful local model, not a universal law of production. The OpenStax managerial accounting chapter on cost behavior distinguishes variable, fixed, mixed and step costs and explains the relevant range.
Classify an expense by its actual driver and contract. A utility bill may combine a standing charge with metered consumption. Paid staffing may remain unchanged across several output levels and then jump when another shift is needed. A label such as “labor” or “electricity” does not supply the behavior by itself.
At the illustrative 6,000-unit boundary, stop extrapolating. Obtain the staffing, capacity and supplier assumptions for the next range, then create a separate scenario. Do not automatically carry $2,400 and $0.60 into a volume at which neither has been checked.
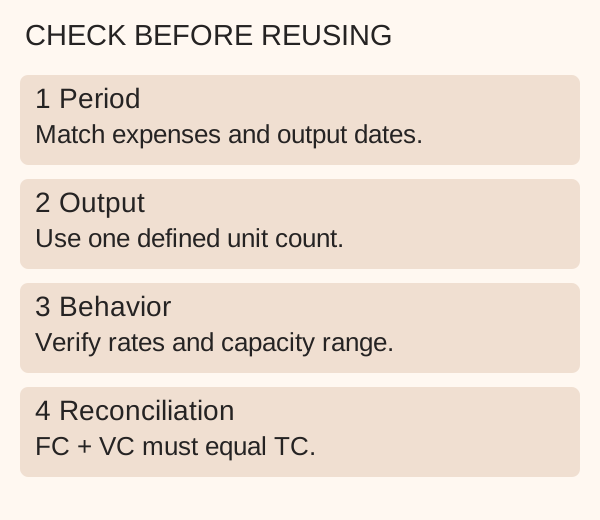
Unplanned downtime cost needs a separate account of what happened to production. Likewise, OEE is an operating measure, not a substitute for a cost ledger. Use those analyses to investigate output assumptions rather than inventing extra dollar entries to force a desired answer.
Takeaway: Recheck the cost drivers whenever output, staffing, purchasing terms or capacity changes.
When this does not apply
This operating-cost illustration is not a calculation of inventory valuation, cost of goods manufactured, taxable profit or full economic cost. It omits financing, equipment purchases and opportunity costs. Add the right categories for your actual question and label the expanded scope.
If variable cost is nonlinear, keep TC = FC + VC but calculate VC from the supported relationship instead of assuming v × Q. If several products share the line, a single unit count may hide differences in work and materials. If output quality changes, return to the good-pack calculation rather than keeping the no-reject assumption.
For investment decisions, use the installed-cost analysis to establish the initial outlay and payback, ROI and TCO guide to choose the appropriate measure. A low operating average alone does not establish an attractive investment.
Takeaway: The identities remain useful, but the chosen cost scope and behavior model must fit the decision.
Frequently asked questions
Can total cost be found from variable cost and output alone?
Not without another assumption or the fixed cost. Knowing VC and Q gives AVC for positive Q, but infinitely many fixed totals could be added to the same VC. An exercise that expects TC must supply enough information to identify FC, directly or indirectly.
Can total cost rise while average total cost falls?
Yes. For an additional-order decision, compare the change in the total with the additional revenue, rather than pricing the extra order from the old average alone. Within this example’s unchanged capacity range, an extra 1,000 units adds $600 of modeled operating cost. Whether to accept the order still requires its selling price and any order-specific costs; neither is supplied here. This is illustrative arithmetic, not a quotation.
Why are total and average costs drawn on separate graphs?
A crossing between a total-cost line and a unit-cost line has no economic meaning: rescaling only one series from dollars to cents would move it visually relative to the other. In a spreadsheet, create two chart panels or clearly distinguished axes; do not interpret a visual crossing as a break-even volume. A break-even analysis also requires revenue, which these charts omit.
Why does the gap between ATC and AVC get smaller?
The gap equals AFC. With a positive fixed total held constant and increasing positive output, FC divided by Q gets smaller. In this example, the gap is $1.20, $0.60 and $0.40 per unit at the three positive output levels; the fixed monthly bill does not change.
How do I identify the variable part of a cost equation?
Look for terms that depend on the stated activity variable, then check what that variable measures. In our equation TC = 2,400 + 0.60Q, the variable part is 0.60Q. That reasoning does not justify replacing a curved cost function with a straight line.
What should an Excel average show when output is zero?
First distinguish a genuine no-production month from missing production data. In the former, keep the known monthly totals and mark averages unavailable; in the latter, request the missing output before drawing conclusions about cost. Microsoft’s division-by-zero guidance also explains that blanket error handling can conceal other errors. Do not make a missing-data row look like a fully checked zero-cost month.
Related reading
- Cost per good pack — bring rejects and the saleable-output denominator into the model.
- Equipment utilization and payback — test how operating volume changes an investment case.
- Contract packing versus owning a line — apply a clearly defined cost scope to an ownership decision.
Methods and sources
Updated October 2026. WonksAnonymous Editors prepared this AI-assisted explanation; no independent human review or factory measurement is claimed. All dollar amounts and charts are original illustrative calculations. Definitions were checked against the two linked OpenStax chapters on October 7, 2026. Vespa was queried, but no relevant library document was used as evidence for these formulas.
FAQ topics draw on published learner questions about finding TC from TVC and Q, production and total cost, fixed and variable cost curves and identifying variable cost, plus OpenStax’s graph-units question and Microsoft’s division-by-zero help. Community questions establish reader demand, not the answers. The answers follow the cited definitions and the arithmetic shown here.